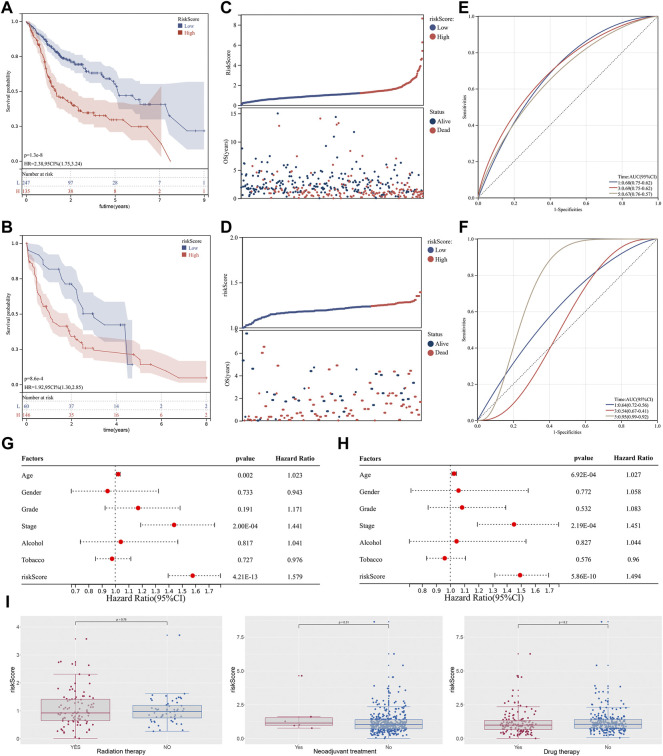
FIGURE 3.
Identification of cuproptosis-related lncRNA based prognostic signature. Notes: (A,B) Kaplan-Meier curve analysis of the signature between two groups in both training cohort and validation cohort. (C,D) In the risk plot, the mortality rate of patients dramatically increased with an increase in riskcore. (E,F) Time-dependent ROC curve analysis of 1-,3- and 5 years in both training cohort and validation cohort. (G,H) Univariate and multivariate cox regression analysis of between the riskscore and clinical features of the signature. (I) Differential expression analysis of riskscore in patients with different treatments status.

