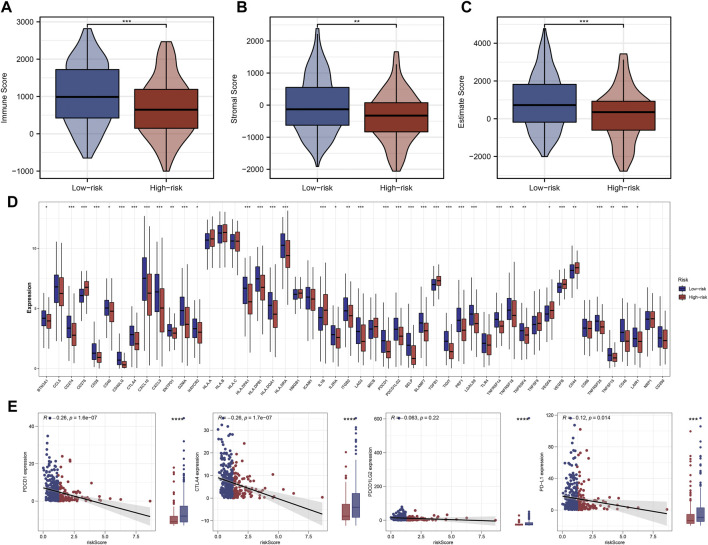
FIGURE 8.
Significant difference of immunity features between two groups. Notes: (A–C) Patients with low riskscore had higher immune scores, stromal scores and estimate scores compared with patients with high riskscore. (D) Differences in expression of 50 common immune-checkpoint–relevant genes between two the groups. (E) Correlations analysis showed that riskscore negatively correlated with CTLA4 and PD-1 expression.

