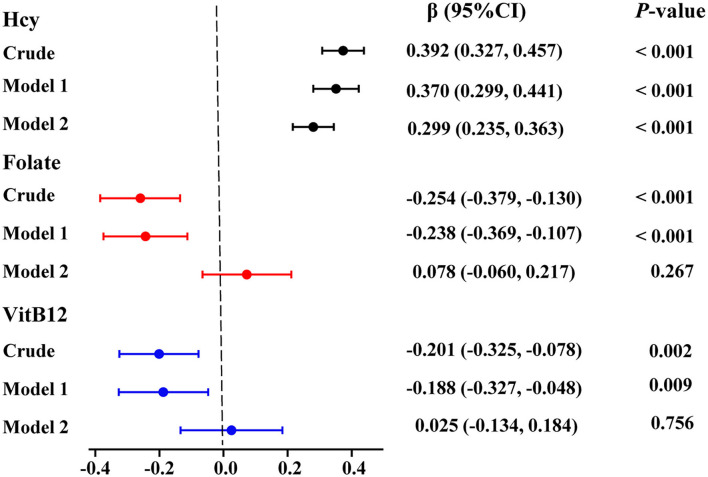
Figure 2.
Multivariate linear logistic regression analysis for the associations between serum Hcy, folate, and VitB12 levels and ASD. Colored points represent the adjusted regression coefficient (β), and horizontal lines represent the 95% CI. “Crude” means no adjustment. Model 1 was adjusted for age, sex, BMI, picky eating, and use of vitamins. Model 2 was adjusted for model 1 and the other two metabolites. Hcy, homocysteine; VitB12, vitamin B12.

