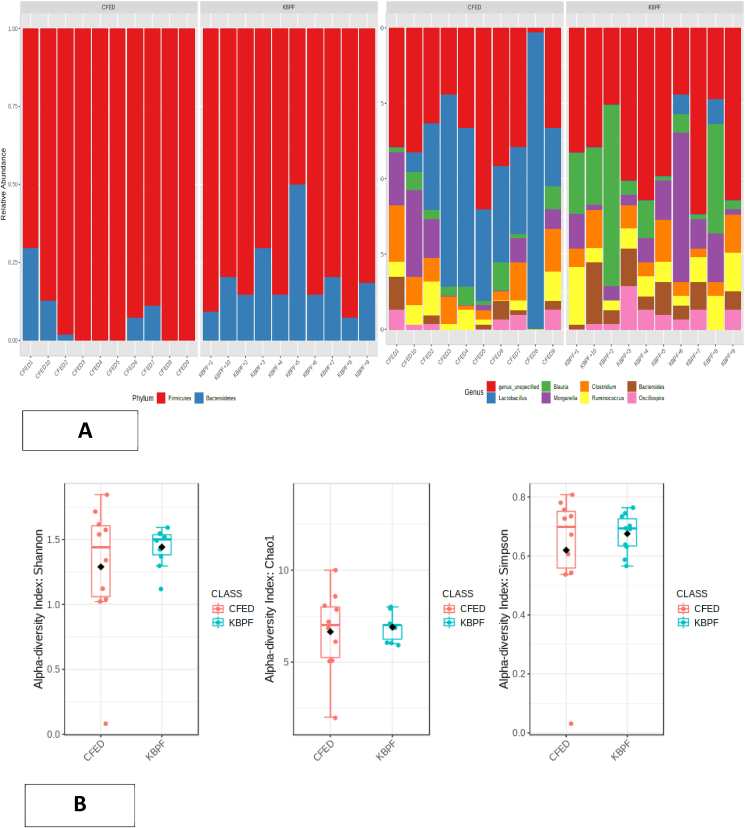
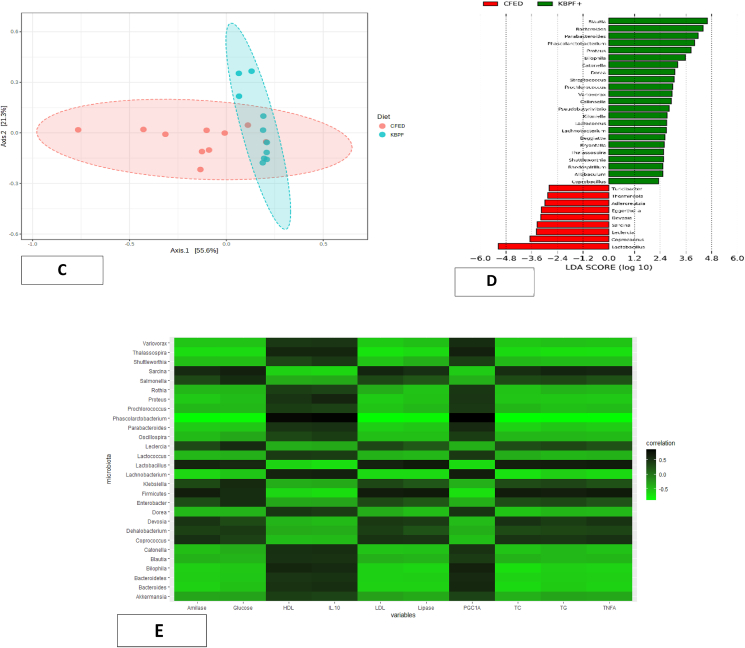
Fig. 9.
Microbiome composition of mice supplemented with High-dose of KBPF. (9A) Bar plots visualize relative abundances of phylum and genera. Each bar represents a mice sample, and each color represents a phylum or genera. (9B) Using class data, alpha diversity was measured using Shannon, Chao1, and Simpson indexes. (9C) Principal coordinates analysis (PCoA) or beta diversity based on Bray-Curtis dissimilarity using the relative abundance of the genus. (9D) LEfSe analysis identified the most differently abundant genus among groups. (9E) Heatmap Pearson correlation analysis between several gut microbiota with certain metabolic and inflammatory biomarkers. (For interpretation of the references to color in this figure legend, the reader is referred to the Web version of this article.)


