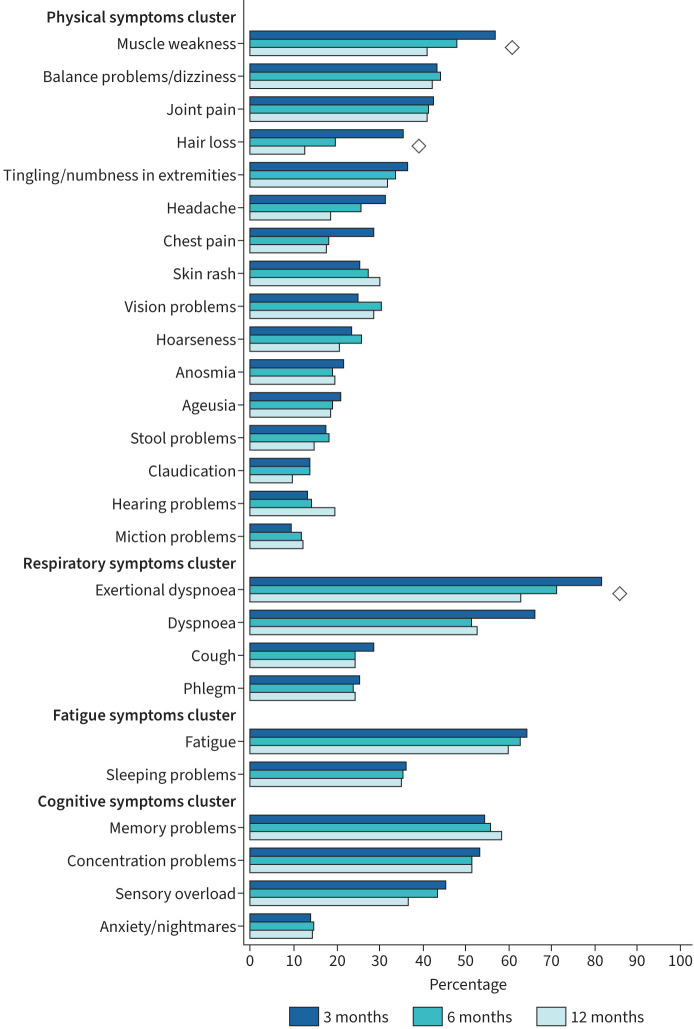
FIGURE 2.
Symptom prevalence over time. Prevalence of COVID-19-related symptoms at 3-, 6- and 12-month follow-up in patients after hospitalisation for COVID-19, sorted by symptoms cluster and from most to least frequently reported. Data are presented as percentage of patients with symptoms. Symptoms marked with ◊ declined significantly over time based on generalised estimating equation analyses, with follow-up visit as fixed factor and symptom (yes/no) at each follow-up visit as dependent variable.

