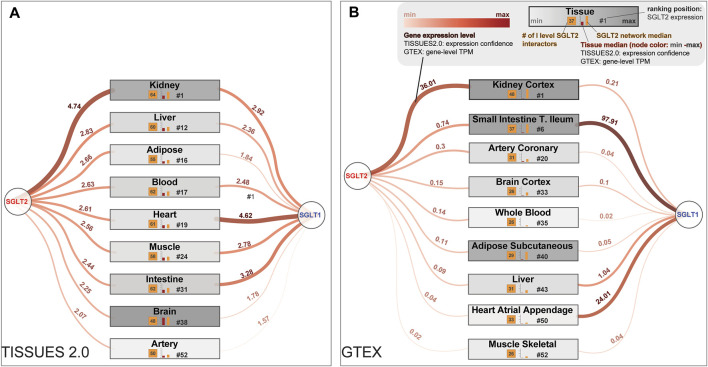
FIGURE 1.
Most interesting tissues from a clinical point of view are sorted by the potential of being affected by SGLT2 and the first-level SGLT2 interaction network. These lists of tissues were generated according to the SGLT2 level, obtained from (A) The TISSUES 2.0 database expression confidence values and (B) Genotype-Tissue Expression (GTEx) project Transcripts Per Million (TPM) values. In the figure are also present expression levels of SGLT1, which is a co-target for some SGLT2 inhibitors. Legend for both panels is shown in the top right corner of panel (B).

