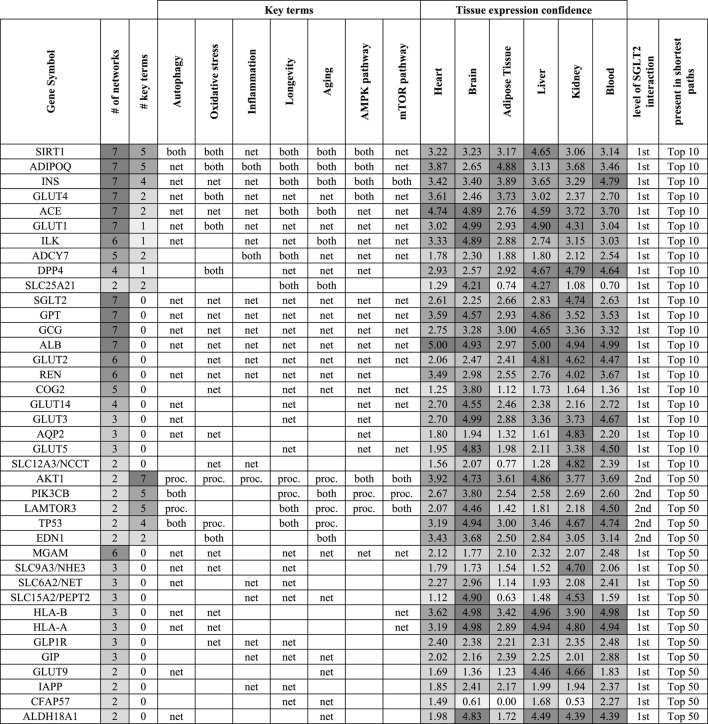
TABLE 1.
Top genes in the context of the level of their interaction with SGLT2, association with key terms (proc.), and presence in shortest paths analysis (net) for top 10 and 50 pathways. If a gene was associated with a key term and was present in shortest paths analysis was marked as “both”. This approach enabled us to identify interesting genes, which could play a role in SGLT2-related regulation and be involved in key terms/processes. Genes were ordered based on their association with the key terms and presence in the top 10 shortest path analyses. On the table are shown genes that appeared in at least two top 50 shortest path analyses. Tissue expression confidence levels (0-5) were retrieved from the TISSUES 2.0 database.

|
