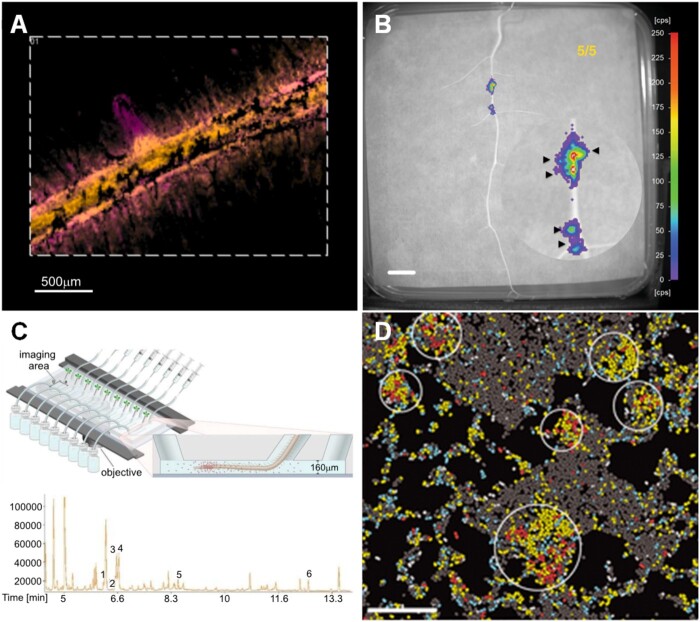
Figure 4.
High-resolution methods to study chemical interactions in the rhizosphere. A, MSI-Imaging of tomato roots, metabolites are distributed in specific root regions as indicated by the overlap of false color images, hydroxytomatine (m/z 1050.54 ± 0.01 Da) in yellow and dehydrotomatine (m/z 1,032.54 ± 0.01 Da) in magenta (color hue was adjusted from Korenblum et al., 2020). B, NightOwl images of bioluminescence of R. leguminosarum Rlv3841/pOPS0046 (a rhizopine biosensor) growing on the surface of M. sativa roots allowed the detection of rhizopine exudation (Geddes et al., 2019). C, The microfluidic device TRIS consists of a series of 6.4 µL chambers, which allowed single-root exudate metabolomics. Ion chromatogram of a metabolic profile of single-root exudates analyzed by gas chromatography–mass spectrometry. Metabolites identified: 1, phosphoric acid; 2, isoleucine; 3, glycine; 4, succinic acid; 5, pyroglutamic acid; and 6, myoinositol (Massalha et al., 2017). D, Transcriptome imaging using par-seq FISH allowed the visualization of the spatial organization of transcriptional programs in P. aeruginosa at single-cell resolution. Using par-seq FISH, transcriptional states of individual cells can be identified and mapped onto the biofilm image (with permission from Dar et al., 2021).

