Figure 1.
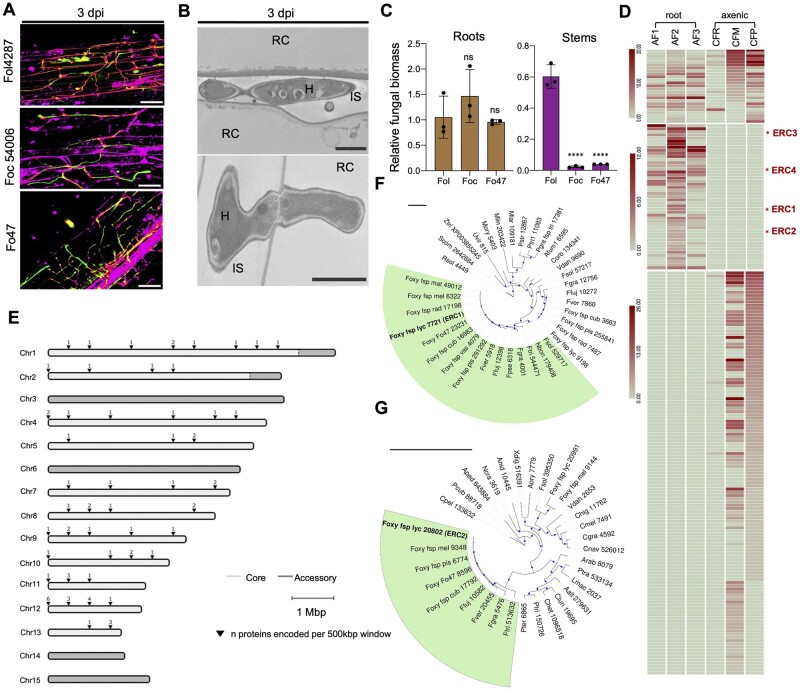
Fo secretes a suite of conserved core effectors in the root intercellular space. A, Confocal microscopy of tomato root colonization of Fo isolates Fol4287 (tomato pathogen), Foc54006 (banana pathogen), or Fo47 (endophyte) expressing 3x-mClover3 at 3 days post infection (dpi). Fungal fluorescence (mClover3-green) is overlaid with propidium iodide staining of plant cell walls (magenta). PI also traces the non-cell-wall apoplastic space. Scale bars, 25 µm. B, Transmission electron micrographs showing hyphae of Fol4287 (H) growing intercellularly (top) or penetrating a root cortical cell (RC; bottom). IS, intercellular space. Scale bars, 2 µm (top); 1 µm (bottom). Note that the penetrating hypha displays an internal cell wall called septum which is related to its growth pattern. C, Fungal burden in roots and stems of tomato plants inoculated with the indicated Fo isolates were measured by qPCR of the Fo actin gene using total DNA extracted at 12 dpi. Fo DNA was calculated using the threshold cycle (ΔΔCt) method, normalized to the tomato gadph gene. Error bars indicate sd; n = 3 biological replicates. Asterisks indicate statistical significance versus Fol4287 [one-way analysis of variance (ANOVA), Bonferroni’s multiple comparison test, P < 0.05]. ns, nonsignificant. Experiments were performed three times with similar results. D, Heat map showing absolute counts of unique peptides of Fol4287 identified by LC‐MS/MS in three independent samples of tomato root AF at 3 dpi (AF 1, 2, 3) or in a single sample of filtrate from axenic cultures in minimal medium with tomato crushed roots (CFR) or sucrose as carbon source (CFM) or potato dextrose broth (CFP). Putative effectors ERC1-4 are highlighted with a red asterisk. Note differences in scale between sections of the heat map. E, Chromosomal distribution plot of the genes encoding Fo Fol4287 proteins identified in tomato AF, showing their localization exclusively in core genomic regions. Core and LS regions are shown in light and dark gray, respectively. F, G, Maximum likelihood phylogenetic trees based on the aligned amino acid sequences of the FOXG_11583 (ERC1) (F) and FOXG_04534 (ERC2) proteins (G), respectively. Number indicates MycoCosm protein ID. Size of blue dots represents bootstrap support for the branch with maximum 100 bootstraps (Tree scale = 1). Fungal species included in the analysis are listed in Supplemental Table S2.

