Figure 2.
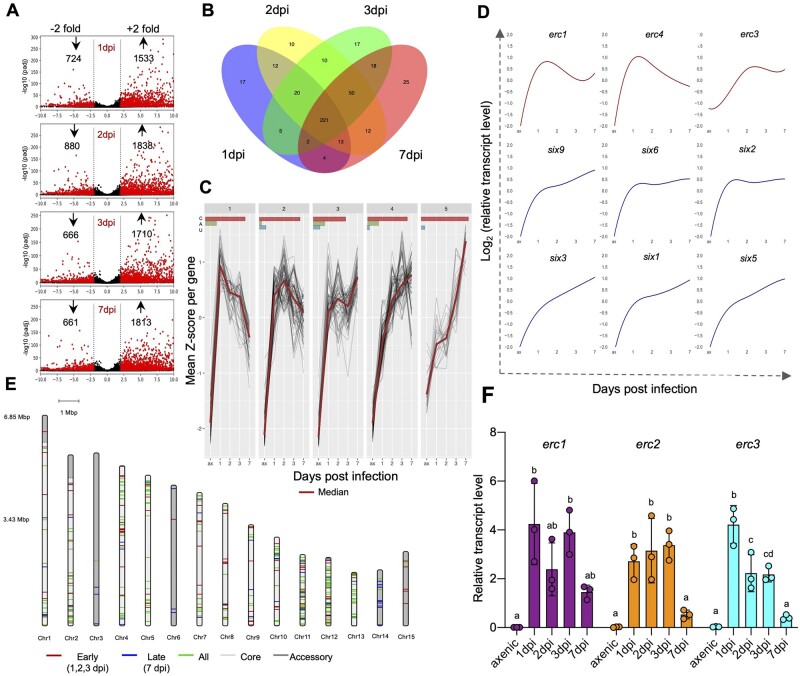
ERCs are upregulated during early biotrophic stages of infection. A, Volcano plot showing pairwise differential expression analysis of Fol4287 genes at the indicated time points post infection in tomato roots versus axenic culture. Significantly DEGs are in red. B, Venn diagram of Fol4287 genes encoding predicted secreted proteins (SPs) upregulated in tomato roots at the indicated time points after inoculation versus axenic culture. A core set of 221 SPs are upregulated in planta across all the analyzed timepoints. C, Clustered expression profiles of genes encoding secreted proteins upregulated in tomato roots versus axenic culture (t test, P < 0.05). Red line, median expression per cluster. The bars at the top indicate the percentage of the genes located in core region (red), accessory region (green), or unmapped region (blue) of the genome represented in each cluster. D, Representative expression profiles of the indicated candidate effector genes plotted as Z-scores of log2 expression versus dpi. Profiles in red correspond to the indicated erc genes located on core genomic regions showing upregulation at early time points with a drop at 7 dpi. Profiles in blue correspond to known SIX effector genes encoded on LS chromosome 14 showing maximum upregulation at 7 dpi. E, Chromosomal distribution of in planta upregulated Fol4287 genes encoding predicted secreted proteins. Red bands are genes preferentially expressed at early infection stages (early to late expression ratio > 0.25). Blue bands are genes preferentially expressed at late infection stages (early to late expression ratio <0.25). Green bands are genes expressed at both early and late infection stages (differentially expressed in at least one early plus the 7 dpi data set versus axenic). Early refers to 1–3 dpi; late refers to 7 dpi. Core and LS genomic regions are shown in light and dark grey, respectively. F, Relative transcript levels of genes FOXG_11583 (erc1), FOXG_04534 (erc2), and FOXG_16902 (erc3) were measured by RT-qPCR of cDNA obtained from Fol4287 grown in minimal medium (axenic) or from roots of tomato plants inoculated with Fol4287 at 1, 2, 3, or 7 dpi. Transcript levels were calculated using the threshold cycle (ΔΔCt) method and normalized to the Fol4287 peptidyl prolyl isomerase (ppi) gene. Error bars indicate sd; n = 3 biological replicates. Different letters indicate statistically significant differences according to one way ANOVA, Bonferroni’s multiple comparison test (P < 0.05).

