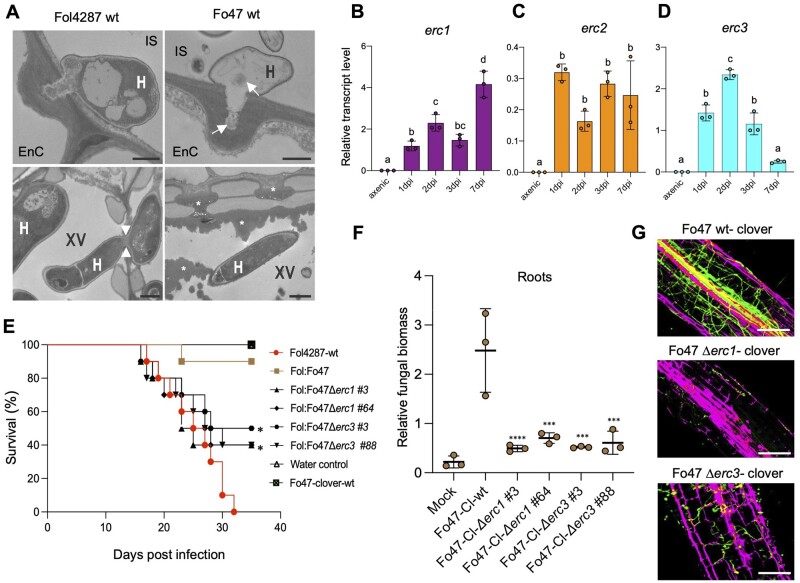
Figure 4.
ERCs are required for endophytic colonization and biocontrol activity of a non-pathogenic Fo strain. A, TEM micrographs showing hyphae (H) of Fol4287 and Fo47 attempting penetration of tomato root endodermis cells (EnC; top) or growing inside xylem vessels (XV; bottom). Note that the penetration hypha of Fo47 is devoid of cytosol and contains only remnants of cell components (arrows). Arrowheads indicate a Fol4287 hypha penetrating an adjacent xylem vessel. Asterisks indicate the deposition of amorphous granular material encapsulating a Fo47 hypha in a xylem vessel or blocking the pits between vessels to inhibit cell-to-cell movement of the fungus. CW, cell wall; IS, intercellular space. Scale bars = 1 µm in top images; 2 µm in bottom images. B–D, Relative transcript levels of the genes FOZG_11686 (erc1), FOZG_02496 (erc2), and FOZG_12886 (erc3) in isolate Fo47 (biocontrol strain) were measured by RT-qPCR of cDNA obtained from fungal mycelium grown in minimal medium (axenic) or from roots of tomato plants inoculated with Fo47 at 1, 2, 3, or 7 dpi. Transcript levels were calculated using the threshold cycle (ΔΔCt) method and normalized to the Fo peptidyl prolyl isomerase (ppi) gene. Error bars indicate sd; n = 3 biological replicates. Different letters indicate statistically significant differences according to one-way ANOVA, Bonferroni’s multiple comparison test (P < 0.05). E, Kaplan–Meier plot showing the survival of tomato plants inoculated with the Fol4287 or Fo47-3x-mClover3 wild-type strains alone or co-inoculated with Fol4287 plus Fo47-3x-mClover3 wild-type or the indicated Fo47-3x-mClover3 Δerc mutants. Number of independent experiments = 3; 10 plants/treatment. Data shown are from one representative experiment. *P <0.05, versus Fol4287 alone according to log-rank test. Note that protection provided by the Fo47-3x-mClover3 Δerc1 and Δerc3 mutants is significantly lower than that provided by the Fo47-3x-mClover3 wild-type strain. F, Fungal burden in roots of tomato plants inoculated with the indicated Fo isolates was measured by qPCR of the Fo47-specific gene (FOBG_10856) using total DNA extracted at 10 dpi. Fo DNA was calculated using the threshold cycle (ΔΔCt) method, normalized to the tomato gadph gene and expressed relative to that in roots inoculated with Fo47-3x-mClover3-wt. Error bars indicate sd; n = 3 biological replicates. Asterisks indicate statistical significance versus Fo47-mClover wild-type (one-way ANOVA, Bonferroni’s multiple comparison test, P < 0.05). The experiment was performed three times with similar results. G, Confocal microscopy images showing tomato roots inoculated with the Fo47-mClover3 wild-type strain or the indicated Fo47-3x-mClover3 Δerc mutants at 3 dpi. Fungal fluorescence (green) is overlaid with propidium iodide staining of plant cells (magenta). Scale bars, 25 µm.

