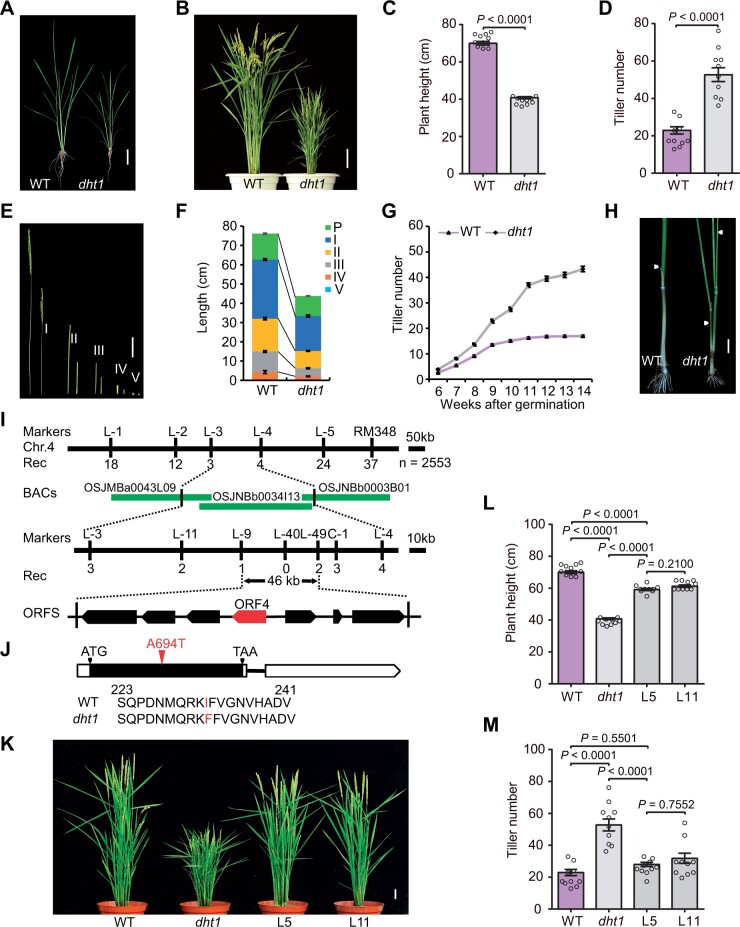
Figure 1.
Phenotypes of dht1 mutant and map-based cloning of DHT1. A and B, Phenotypes of WT and dht1 plants at the sixth leaf stage (A) or the heading stage (B). Scale bars, 5 cm (A), 10 cm (B). C and D, Comparison of plant height and tiller number between WT and dht1 plants. Data are means ± sem (n = 10) and P-values are from two-sided Student’s t test. E and F, Comparison of internode length between WT (left) and dht1 plants (right). P, I, II, III, IV, and V indicate the panicle, the first, the second, the third, the fourth, and the fifth internode, respectively. Scale bars, 5 cm (E). Data in (F) are means ± sem (n = 10). G, Comparison of tiller number between WT and dht1 plants from 6th week to 14th week. Data are means ± sem (n = 50). H, Comparison of tillers on the elongated upper nodes between WT and dht1 plants. White arrowheads indicate the un-elongated tiller buds (WT) and the elongated tillers (dht1) on the elongated upper nodes. Scale bars, 2 cm. I, The dht1 locus was mapped on chromosome 4. Molecular markers and recombinant numbers are shown above and below the line, respectively. The red arrow denotes the candidate ORF. J, Mutation in the DHT1 gene. In the DHT1 gene structure diagram, the white and black boxes represent untranslated regions and CDS, respectively; the black line between boxes represents intron. ATG and TAA represent the start and stop codon, respectively. The A-to-T nucleotide substitution at 694 bp from the ATG initiation code and corresponding amino acid substitution of protein in the dht1 mutant are highlighted in red fonts. K, Complementation test by introducing the full-length DHT1 genomic fragment into the dht1 mutant. L5 and L11 are two independent transgenic lines. Scale bars, 5 cm. L and M, Comparison of plant height and tiller number between WT, dht1 and two complemented transgenic lines. Data are means ± sem (n = 10) and P-values are from one-way ANOVA test with Tukey’s correction.

