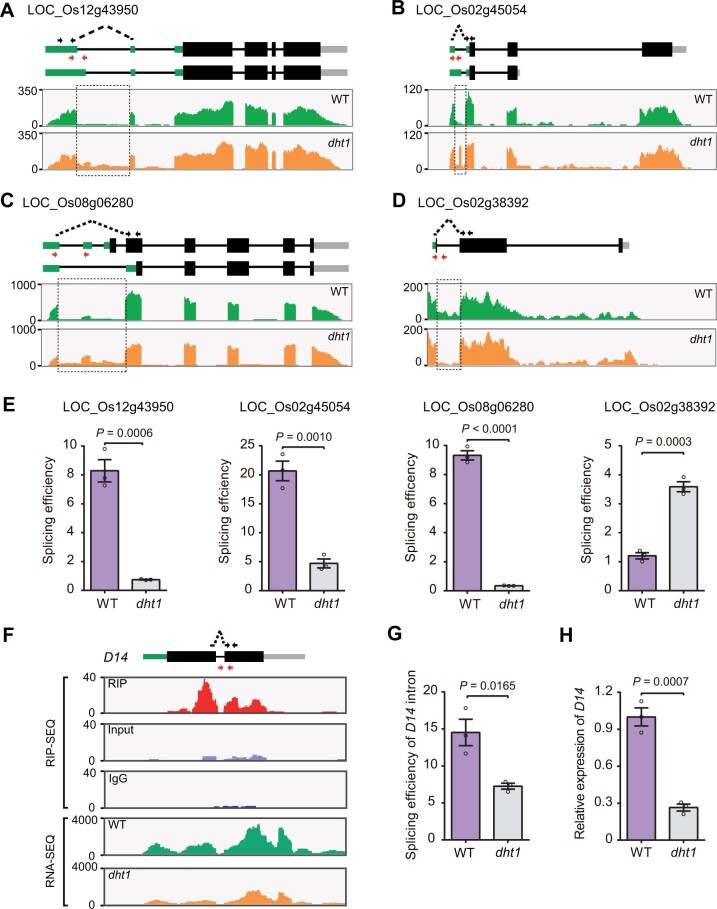
Figure 5.
DHT1 regulates pre-mRNA splicing and intron splicing of D14. A–D, Confirmation of splicing defects between WT and dht1 mutant by RNA-seq. The sequencing read abundance of RNA-seq data is indicated as wiggle plots (green for WT; orange for dht1) in the bottom panel. The genomic structure of gene is shown at the top. Black arrows indicate the primers used to measure the spliced events. The spliced primers crossing exon–exon junctions are represented by black dotted arrows. Red arrows represent the primers used to measure the unspliced events. The dashed rectangle showing locations on the gene where splicing defects occur. E, Corresponding splicing efficiencies of the genes (shown on Figure 5, A–D) in WT and dht1 mutant by RT-qPCR. The splicing efficiency was calculated as the ratio of spliced RNAs to unspliced RNAs, with the primers shown in Figure 5, A–D. F, Profile of DHT1 binding to the transcripts of D14 gene in WT and the abundance of D14 transcript between WT and dht1. The genomic structure of D14 is shown at the top. Black arrows crossing the exon-exon junctions indicate the primers for detecting the spliced events. Red arrows represent the primers for detecting the unspliced events. Wiggle plots of RIP-seq (red for RIP; purple for Input; blue for IgG) and RNA-seq (green for WT; orange for dht1) are shown below the gene structure. The y-axis indicates sequencing read abundance of RIP-seq data or RNA-seq data. The x-axis indicates D14 gene chromosomal position. G, Splicing efficiencies of the D14 gene in the tiller buds of WT and dht1 by RT-qPCR validation. The splicing efficiency was calculated as the ratio of spliced D14 RNA to the level of unspliced D14 RNA. H, RT-qPCR analysis showing D14 mRNA levels in the tiller buds of WT and dht1. Data in (E, G, and H) are means ± sem (n = 3). P-values are from two-sided Student’s t test.

