Figure 8.
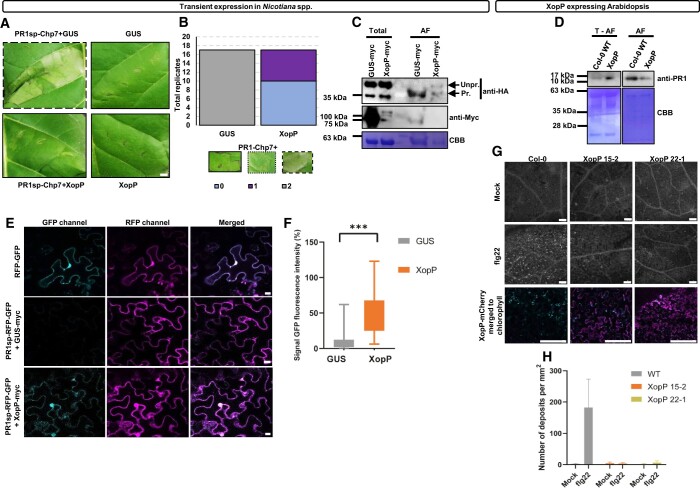
XopP inhibits both the exocytosis of PR1a and the deposition of callose. A and B, HR inhibition assay (A) and quantification (B). XopP inhibited the apoplastic HR induction by the chimeric protein PR1sp–Chp7. Inhibition of the HR (left lower lane) appeared 3 dpi in N. tabacum leaves. GUS protein was used as an HR negative control. The expression of GUS or XopP alone did not induce HR (right lanes). Data represent three independent experiments, each containing approximately five measurements (n = 17 measurements). Additional negative controls are presented in Supplemental Figure S10, A–D. For the quantification, the data are from four independent experiments, each containing approximately five measurements (n = 17). Representative images are shown along with the score, where 0 = no HR, 1 = medium HR, 2 = HR in all the area of the infiltrated leaf. The statistical analysis was made with two-way RM ANOVA (Interaction P <0.0001, Row factor P = 0.1221, and Column factor P >0.9999). The parameters of the statistical analysis are shown in Supplemental Data Set 3. Bar = 1 cm. C, Inhibition of the chimeric protein PR1sp–Chp7 secretion by XopP. PR1sp–Chp7–HA was co-expressed with GUS-myc or XopP-myc in N. benthamiana leaves. AF separation and total protein extraction were performed at 3 dpi. Immunoblot analysis with an anti-HA antibody showed that, in the presence of XopP, a significant portion of the chimeric protein PR1sp–Chp7 was not processed (Unpr.) as it was observed by the shift in molecular weight of the protein before the cleavage of PR1sp of the secreted PR1sp–Chp7 (Pr.). PR1sp–Chp7–HA (C) is 43 kDa, whereas Chp7–HA (A) is 38 kDa. Expression of XopP-myc (86 kDa) and GUS-myc (74 kDa) was shown using an anti-myc antibody. Staining of the PVDF membrane with CBB was used as loading control. D, Inhibition of PR1 secretion in XopP overexpressing transgenic Arabidopsis plants. Arabidopsis WT and XopP transgenic plants were infiltrated with 1-μM flg22 and after 12 h, AF separation was performed. The proteins of the rest of the leaves (Total − AF fraction) were also extracted. Immunoblot analysis using anti-PR1 antibody showed reduced PR1 secretion in XopP transgenic plants relative to WT Col-0 Arabidopsis. Staining of the PVDF membrane with CBB was used as loading control. PR1 is approximately 15 kDa. E and F, Expression (E) and quantification (F) of the chimeric protein PR1sp–RFP–GFP in the absence or presence of XopP. In the upper, the chimeric protein RFP–GFP (without being fused with the secretion peptide) was expressed in the cytoplasm. Fusion of the PR1sp to the N-terminus of the RFP–GFP chimera (PR1sp–RFP–GFP) resulted in exocytosis to the apoplast of the RFP–GFP. Only RFP was visualized (magenta) as the GFP (cyan) was quenched in the acidic environment of the apoplast. When XopP was expressed along with PR1sp–RFP–GFP, exocytosis of RFP–GFP exocytosis was inhibited, and it relocalized to the cytoplasm and nuclei, as both fluorescent proteins were detectable. The images were taken via confocal microscopy at 3 dpi of N. benthamiana leaves. Bars in (E) = 10 μm. The experiment was repeated four times with similar results. Quantification of GFP fluorescence intensity of PR1sp–RFP–GFP infiltrated with GUS or XopP in N. benthamiana plants was performed. Quantification was performed using Image J software, and statistical analysis was made with unpaired t test. Data in (F) show means 8.93 for GUS and 47.05 for XopP and the difference between means (XopP – GUS) ± sem is 38.12 ± 2.90 (n =110 measurements each). The measurement has been done from three different biological replicates. The P <0.0001. The parameters of the statistical analysis are shown in Supplemental Data Set 3. G and H, Visualization (D) and quantification (E) of callose deposition after PTI elicitation with 20-μm flg22 (middle lane) or mock solution (upper lane), in T1 lines of transgenic A. thaliana lines (15-2 and 22-1 lines) expressing XopP-mCherry. In the lower, XopP-mCherry expression (magenta) together with chlorophyll (cyan) was imaged via confocal microscopy, and it was in accordance with the levels of callose secretion. Bars in (G) = 15 μm. Quantification has been made using Image J software, and statistical analysis was made with ordinary two-way ANOVA (Interaction P <0.0001, Row factor P = 0.0001, and Column factor P <0.0001). Data in (H) show means 3.00 for WT mock, 182.30 for WT flg-22 treated, 4.50 for XopP 15-2 mock, 3.67 for XopP 15-2 flg22 treated, 1.75 for XopP 22-1 mock, and 6.33 for XopP 22-1 flg22 treated. The measurements are from two biological replicates. ***P < 0.0005.

