Figure 1.
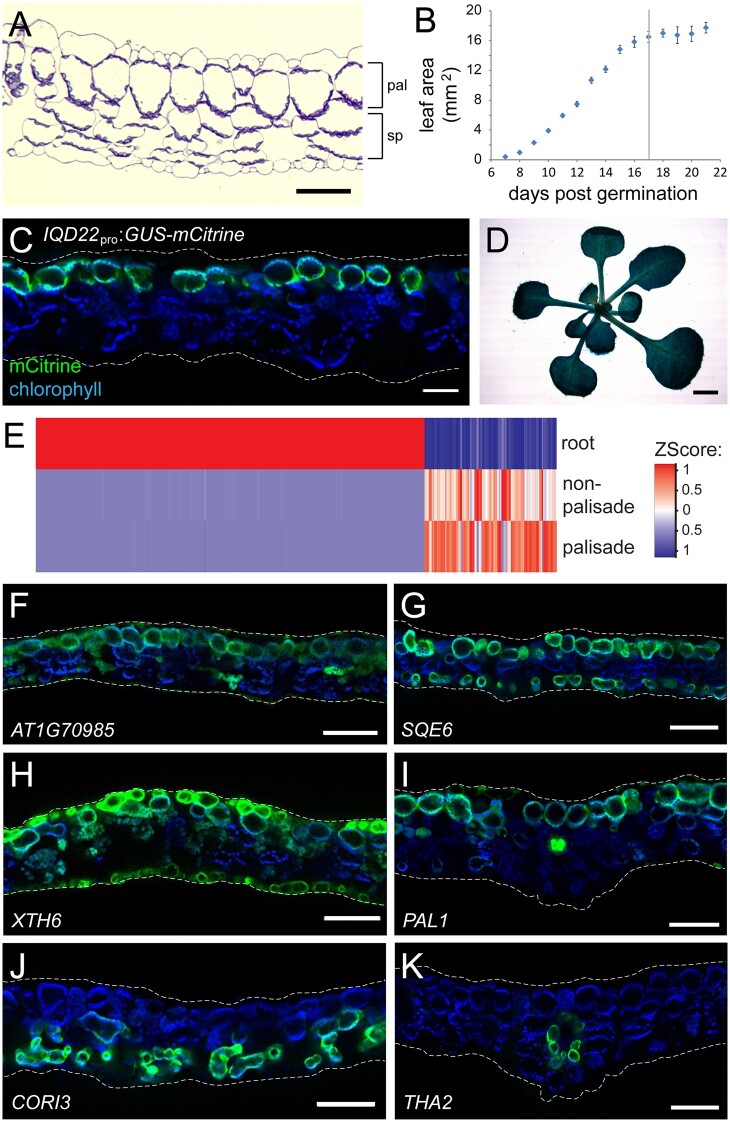
FAC sorting of IQD22pro:GUS-mCit leaf protoplasts can enrich for palisade mesophyll cells. A, Toluidine blue-stained cross-section of a mature Arabidopsis leaf (first true leaf pair), showing a single layer of palisade mesophyll (pal) and spongy mesophyll (sp) below. B, Growth of the first true leaves. In our conditions, the leaves reached their maximum area at 17 days postgermination (vertical line). Mean ± sem. C, Fluorescence image of a leaf cross-section from a 17-day-old IQD22pro:GUS-mCit reporter plant. Chlorophyll autofluorescence is shown in blue and highlights chloroplasts of the mesophyll cells. GUS-mCit protein (green) is expressed in palisade cells. D, Image of the shoot of a GUS-stained IQD22pro:GUS-mCit plant at day 17. E, Heatmap comparing expression of the top 500 most differentially-regulated genes (columns) identified from pairwise comparisons between total root protoplasts and FAC sorted palisade and nonpalisade photosynthetic cell populations from IQD22pro:GUS-mCit leaves. F–K, Fluorescence images of example transcriptional reporters of genes identified as being upregulated (F–I) or downregulated (J and K) in palisade mesophyll compared with nonpalisade photosynthetic cells by FAC sorting. Leaf cross sections of 17-day-old T1 plants are shown (n ≥ 5). Chlorophyll autofluorescence, blue, and gene promoter:GUS-mCit reporter, green. Note reporter activity in the palisade cells in (F–K), as well as additional cell types. (I) and (K) are at the location of the midvein; other panels are lateral. Note that when imaging mCit at high exposures in (F) and (H), some autofluorescence is also observed from the cuticle and chlorophyll. Scale bars: (A) and (C), 50 μm; (D), 2 mm; (F–K), 100 μm. In (A), (C), and (F–K), adaxial is up. In (C) and (F–K), dashed white lines show approximate position of cuticle.

