Figure 3.
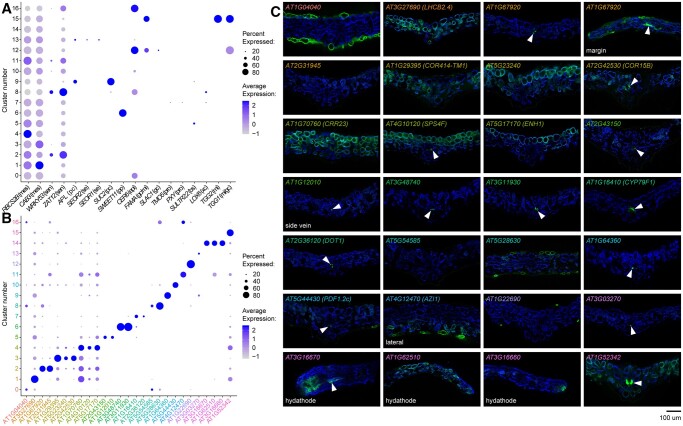
Gene marker analysis of scRNA-seq cell clusters. A, Dot plot showing expression of known tissue-specific marker genes in the scRNA-seq leaf cell clusters (see Figure 2A). Dot color intensity represents average expression of the gene in a given cluster, and dot size the percentage of cells in the cluster expressing that particular marker. Markers are expressed in mesophyll (mes), senescing cells (sen), phloem companion (pc), sieve elements (se), phloem parenchyma (pp), epidermis (epi), GCs (gc), myrosinase idioblasts (mi), procambium (pro), bundle sheath and veins (bs), and xylem contact cells (xc). B, Dot plot showing expression of de novo-identified cluster marker genes. Gene name color is the same as the cell cluster in Figure 2A for which the marker gene was identified. C, Fluorescence images of transcriptional reporters for genes shown in (B). Cross sections of first true leaves of T1 transgenic plants are shown (representative from n ≥ 4 T1 plants). Chlorophyll autofluorescence, blue, and gene promoter:GUS-mCit reporter activity, green. Adaxial is up. All images are at the midvein except where otherwise indicated (margin, side vein, lateral or hydathode). Arrowheads mark vascular and/or bundle sheath expression in some lines.

