Figure 5.
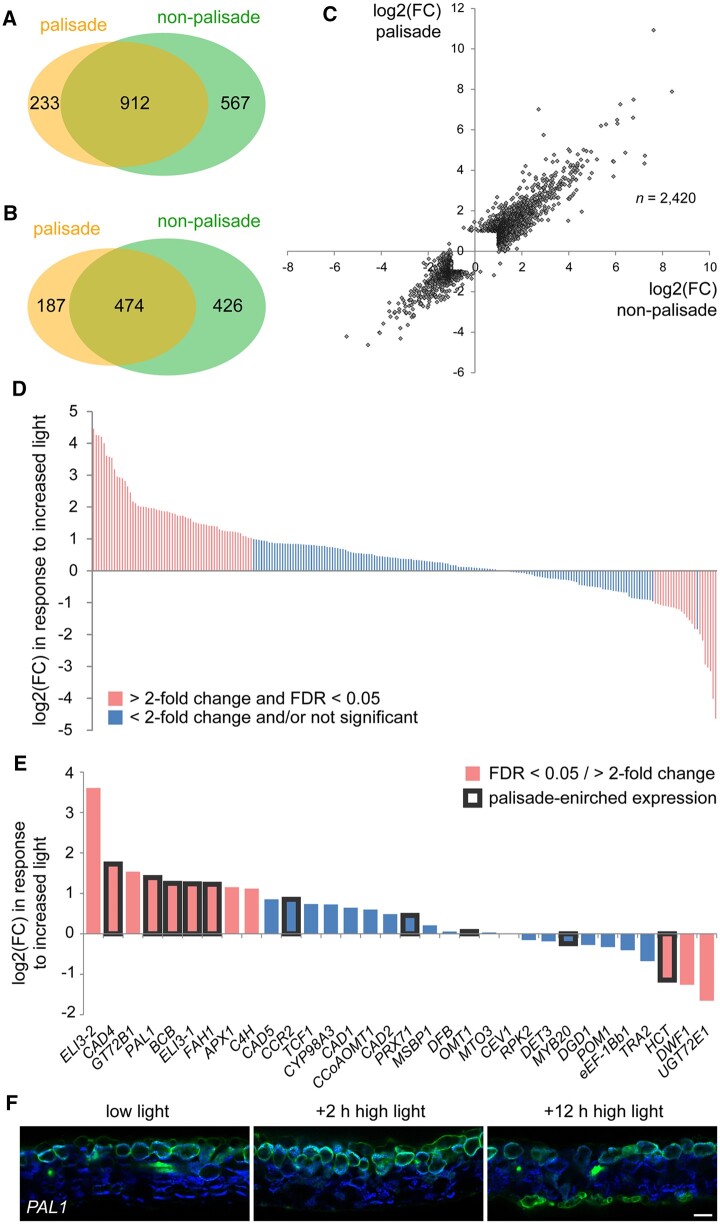
Effect of high light on gene expression in the palisade mesophyll. A and B, A comparison of the genes induced (A) and repressed (B) by high light in FAC sorted palisade cells compared with the photosynthetic reference cell population (FDR < 0.05 and fold change (FC) > 2). IQD22pro:GUS-mCit plants were grown for 17 days at 50 μmol m−2 s−1. High light treated plants were then moved to 300 μmol m−2 s−1 for 2 h prior to protoplasting. The two cell populations have a high degree of overlap in the genes that are regulated (P < 0.005, hypergeometric test). C, A comparison of the FC in gene expression in response to high light for all genes identified as differentially regulated by light in either the palisade or reference cell population. Note that most genes are regulated to a similar degree in the two populations. D, FC in expression when responding to the high light stimulus for genes identified as upregulated in the palisade mesophyll by FAC sorting (bars on x-axis). Genes significantly regulated by light (FDR < 0.05) with FC > 2 are indicated. E, The high light response of genes associated with GO term “lignin biosynthetic process” (GO:0009809) detected in our RNA-seq experiment in the FAC-sorted palisade mesophyll cells. Genes also identified as upregulated in the palisade are boxed in black. F, Representative fluorescence images of first true leaf cross-sections of T1 plants carrying a PAL1pro:GUS-mCit reporter (green). Plants were grown at 50 μmol m−2 s−1 (low light) for 17 days then shifted to 300 μmol m−2 s−1 (high light) for 2 or 12 h prior to imaging (n = 6 T1 plants each condition). Images were taken at the same exposure. Note a shift in reporter expression to the abaxial epidermis after 12-h high light. Chlorophyll autofluorescence, blue. Scale bar: 50 μm. Adaxial is up.

