Figure 4.
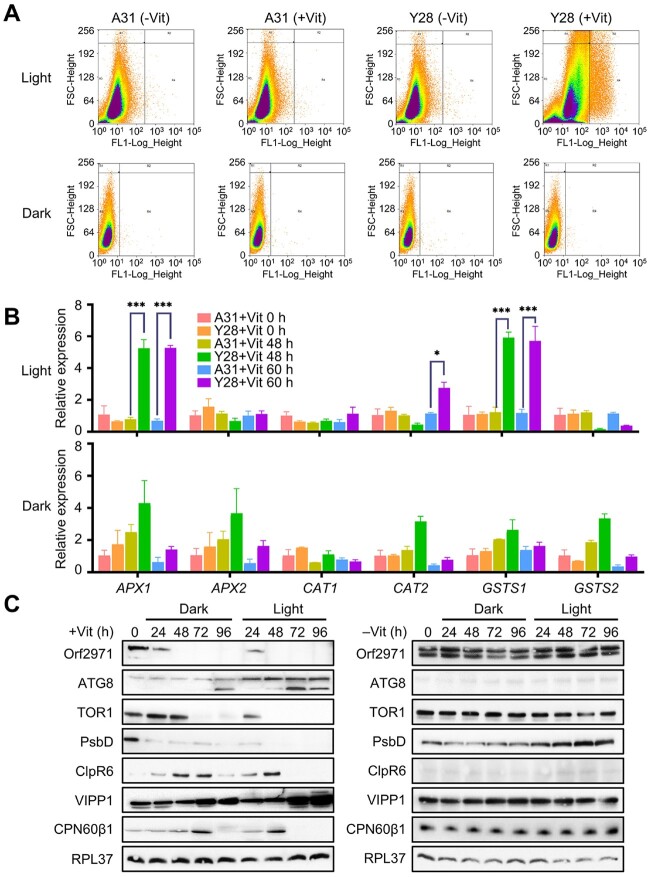
Accumulation of ROS upon repression of Orf2971. A, Scatter plot of ROS-induced DCF-DA fluorescence from samples with 400,000 cells of A31 and Y28 in the light and 100,000 cells in the dark in the absence or presence of vitamins showing coincidence of elevated ROS. FSC-Height (Y-axis) indicates cell size and cell surface area, FL1-Log-Height (X-axis) indicates ROS fluorescence intensity. B, Levels of expression of ROS-related marker genes in the light or dark upon Orf2971 repression determined by qPCR. Data are represented as mean ± sd. C, Analysis of proteins from Y28 grown in the light or dark upon Orf2971 repression. Proteins were extracted at different time points and immunoblotted with the antisera as indicated on the left.

