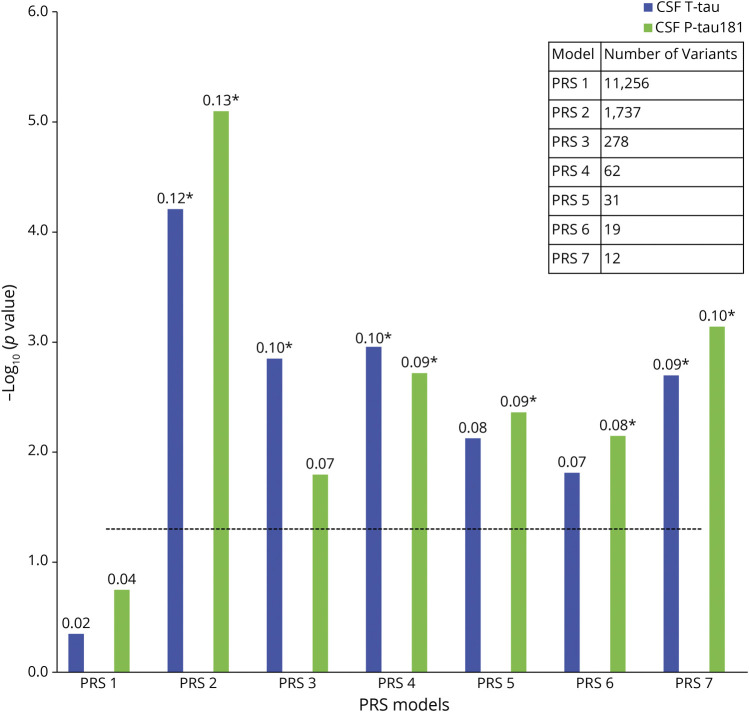
Figure 1. Associations Between PRSs and Tau Measures.
The x-axis represents the 7 different PRS models at different p value thresholds based on the GWAS summary statistics (PRS1 ≤ 0.05, PRS2 ≤ 5e-3, PRS3 ≤ 5e-4, PRS4 ≤ 5e-5, PRS5 ≤ 5e-6, PRS6 ≤ 5e-7, and PRS7 ≤ 5e-8). The models were adjusted for age, sex, education, baseline MMSE, APOE ε2 and ε4 count, and the top 10 principal components from the principal component analysis on the entire set of genotype data. The y-axis shows the negative log of the p value for the significance of associations between PRS models with different tau measures. The values on the top of each bar show the association's effect size (β-coefficient). The horizontal dotted line shows the p value threshold of 0.05. *These PRSs were significant after Bonferroni correction at p value <0.05. GWAS = genome-wide association study; MMSE = mini‐mental state examination; PRS = polygenic risk score.

