
Figure 1. PRS in Amyloid (+) and Amyloid (−) Participants From the INSIGHT Cohort: A-PRS (A and B) and oA-PRS (C and D).
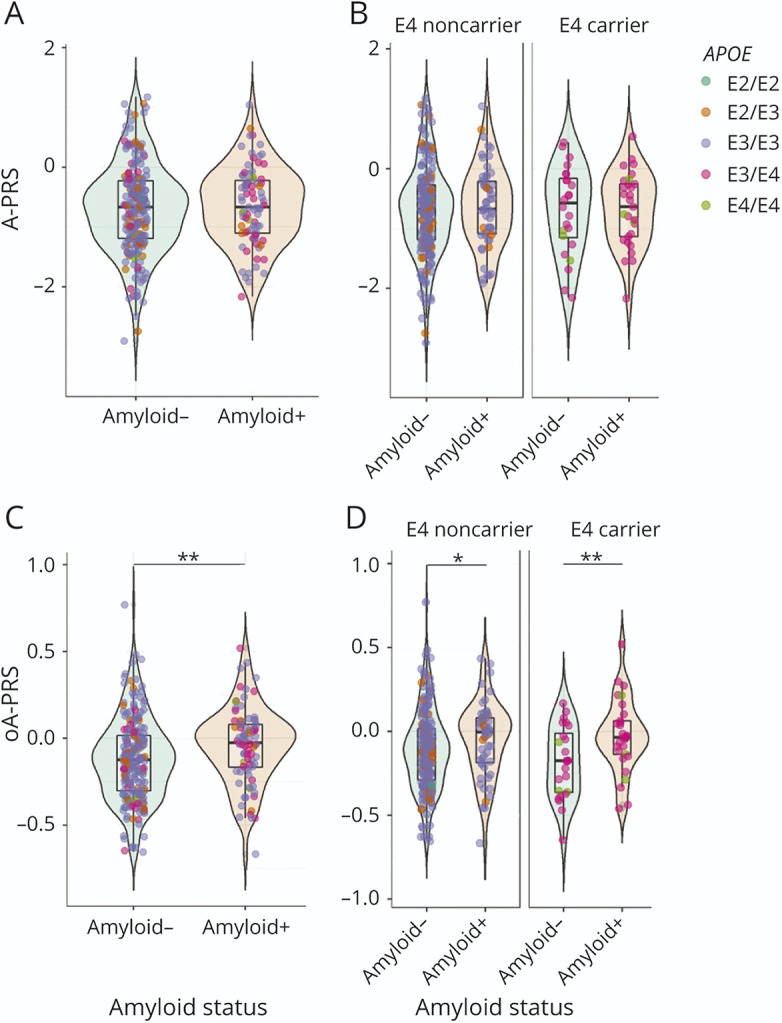
Green-colored violin plots correspond to amyloid (−) participants, and orange-colored plots correspond to amyloid (+) participants. Each participant is represented by a colored dot corresponding to their APOE status: dark green for ε2/ε2, orange for ε2/ε3, violet for ε3/ε3, pink for ε3/ε4, and light green for ε4/ε4. For the stratified graphs, participants who did not carry any ε4 allele were classified as an “E4 noncarrier,” and those who did were classified as an “E4 carrier.” The A-PRS is not associated with amyloid status in the whole INSIGHT cohort (A) and in the ε4 carriers (B). The oA-PRS is significantly associated with amyloid status (C) (p = 0.005), and this association persists in the ε4 carriers (p = 0.0034) (D); asterisks indicate statistically significant differences (*p < 0.05, **p < 0.001). The A-PRS and oA-PRS were not significantly different between APOE statuses among amyloid (+) and (−) participants. A-PRS = Alzheimer's PRS; oA-PRS = optimized Alzheimer's PRS; PRS = polygenic risk score.