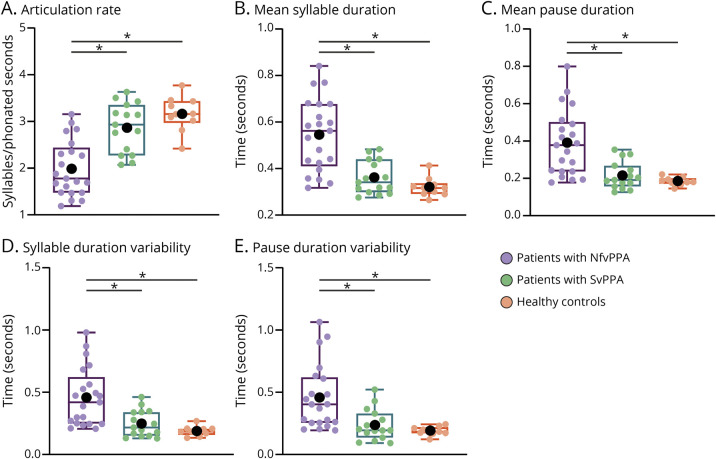
Figure 1. Results for the 3-Group Setting (All Patients With nfvPPA Together).
All 5 speech timing measures revealed significant impairments in patients with nfvPPA relative to both healthy controls and patients with svPPA. No differences were observed between the latter 2 groups. In the box plot, middle horizontal lines show each group's median, with lower and upper lines representing the 25th and 75th percentiles, respectively. The whiskers represent the smallest and largest values in the distribution. Colored dots indicate each participant's individual value. Black dots represent the group's mean. *Denotes significant differences at p < 0.05. All statistics were calculated after outlier removal (namely, a single nfvPPA-PSP participant). NfvPPA = nonfluent variant primary progressive aphasia; svPPA = semantic variant primary progressive aphasia.

