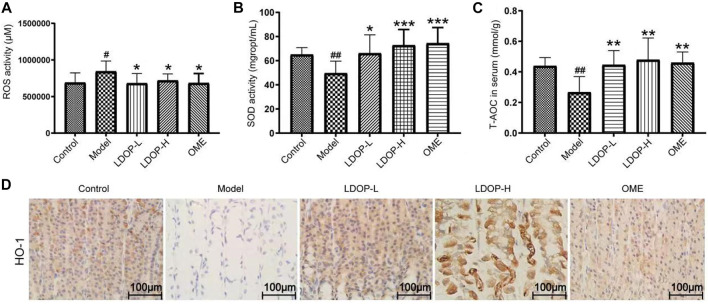
FIGURE 4.
Effects of LDOP-1 on oxidative stress. ROS (A), SOD (B) and T-AOC (C) were measured by biochemical Assays and the expression of HO-1 (D) was examined by immunohistochemical analysis (400×, brown yellow granules indicate positive reaction). Data are expressed as the mean ± SD of three independent experiments. #p < 0.05, ##p < 0.01 compare the control group; *p < 0.05 and **p < 0.01, ***p < 0.001 compare model group. LDOP-L stood for LDOP-1-L, LDOP-H stood for LDOP-1-H.

