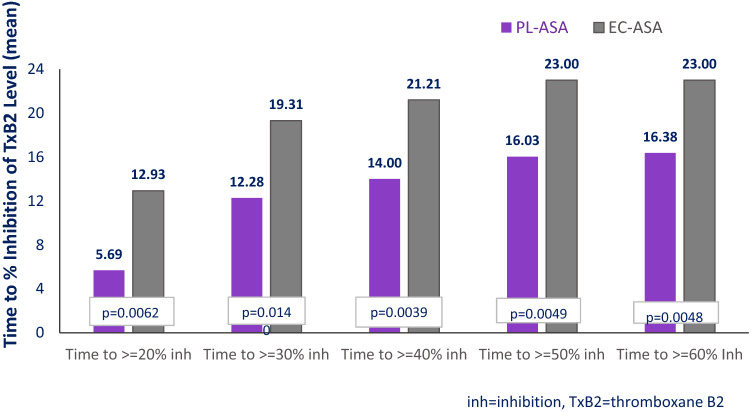
Fig. 4.
Time to Inhibition of TxB2 Production, hours (N = 21). Values are significantly different at all timepoints. p-values were calculated by using mixed-effects, repeated-measure ANOVA model with sequence, period, and treatment as fixed effects and subject as a random effect. The time to cut-off was set as 24 h if the cutoff point was not achieved at 24 h post dose. The TxB2 analysis was based on 21 subjects who had valid TxB2 concentration data

