Figure 1.
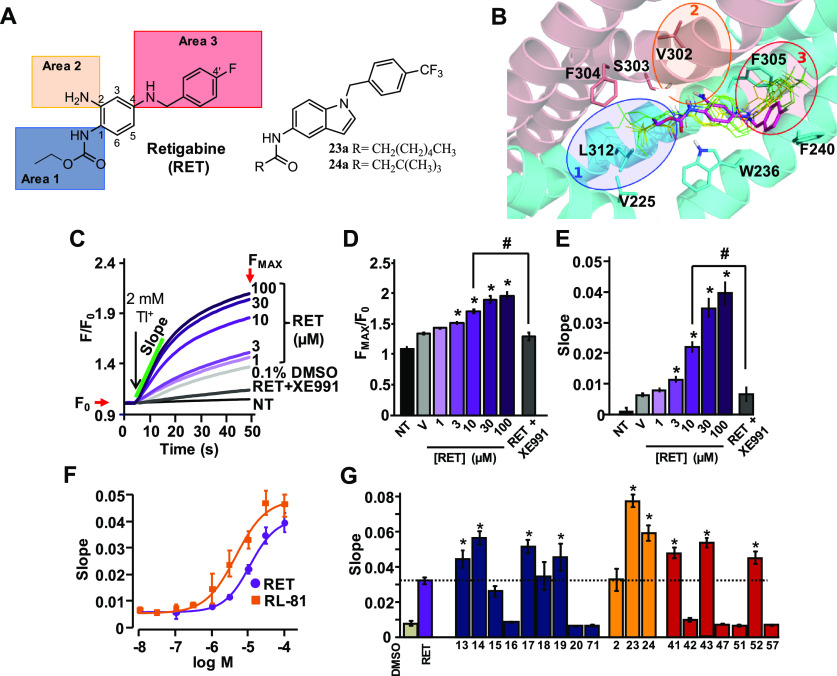
Functional characterization of a first series of retigabine derivatives (compounds 13–20, 71, 2, 23, 24, 41–43, 47, 51, 52, 57). (A) Retigabine compounds 23a and 24a structures with the three different areas investigated by structure-based approach. Highlighted: area 1 in blue, area 2 in orange, and area 3 in red. (B) Retigabine binding pocket in Kv7.2 channels. The two Kv7.2 subunits shown are colored in cyan and salmon. Bound conformations of 23a (yellow) and 24a (green) are shown in thin solid sticks. For each ligand, three bound conformations (sampled at 0, 60, and 120 ns from 120 ns-long MD simulations of the ligand/Kv7.2 complex) are shown. Experimentally solved bound conformation of retigabine (PDB ID: 7CR2) is shown in magenta thick transparent sticks. (C) FluxOR fluorescence signals generated in Kv7.2/Kv7.3-transfected cells by the following: vehicle DMSO 0.1% (gray curve), retigabine (RET, purple curves), and retigabine + XE991 co-administrated (black curve). Non-transfected cell (NT) signal is also shown. (D,E) Average value of maximal fluorescence (FMAX/F0; D) and initial slope (E) of the FluxOR fluorescence signal calculated between 5 and 15 s. (F) Dose–response curves of RET (purple) and RL-81 (yellow). Solid lines represent fits of the experimental data to the four parameter logistic equation used to estimate EC50 values. (G) Average FluxOR fluorescence signals obtained in Kv7.2/Kv7.3-transfected cells upon exposure to the synthesized compounds exploring the chemical space at area 1 (blue bars), area 2 (orange bars), and area 3 (red bars) at a concentration of 10 μM in comparison with retigabine (purple bar). * and # indicate values significantly different (p < 0.05) from respective controls.

