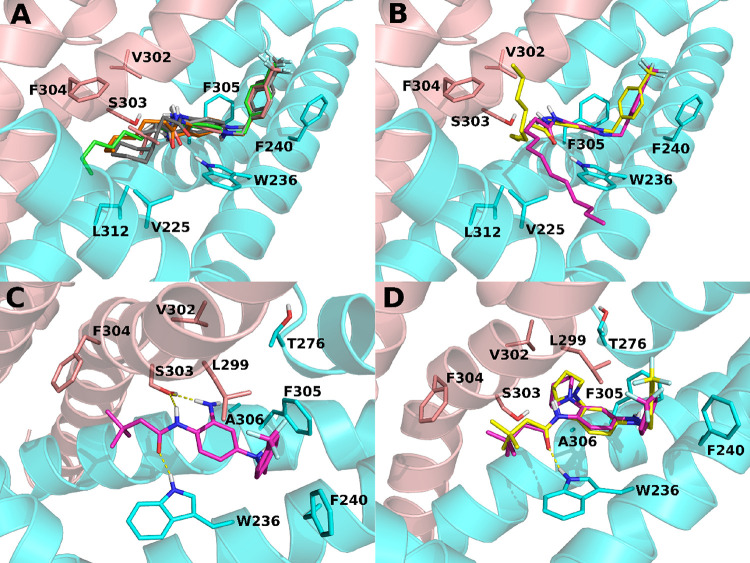
Figure 2.
Molecular dynamics (MD) simulations of retigabine analogues. (A) Predicted bound conformations of 13 (orange), 14 (green), 17 (pink), 18 (light gray), and 19 (dark gray) at 60 ns of MD simulations are depicted in sticks. (B) Bound conformations of 15 (yellow) and 16 (magenta) at 60 ns of MD simulations are depicted in sticks. (C) Predicted bound conformation of 17 (magenta sticks) at 60 ns of MD simulations. (D) Predicted bound conformations of 23 (yellow sticks) and 24 (magenta sticks). In all panels, the two different Kv7.2 monomers are depicted in sticks and cartoons and colored in cyan and salmon. H-bonds are represented by yellow dashed lines.

