
Table 5. SAR around 15e.

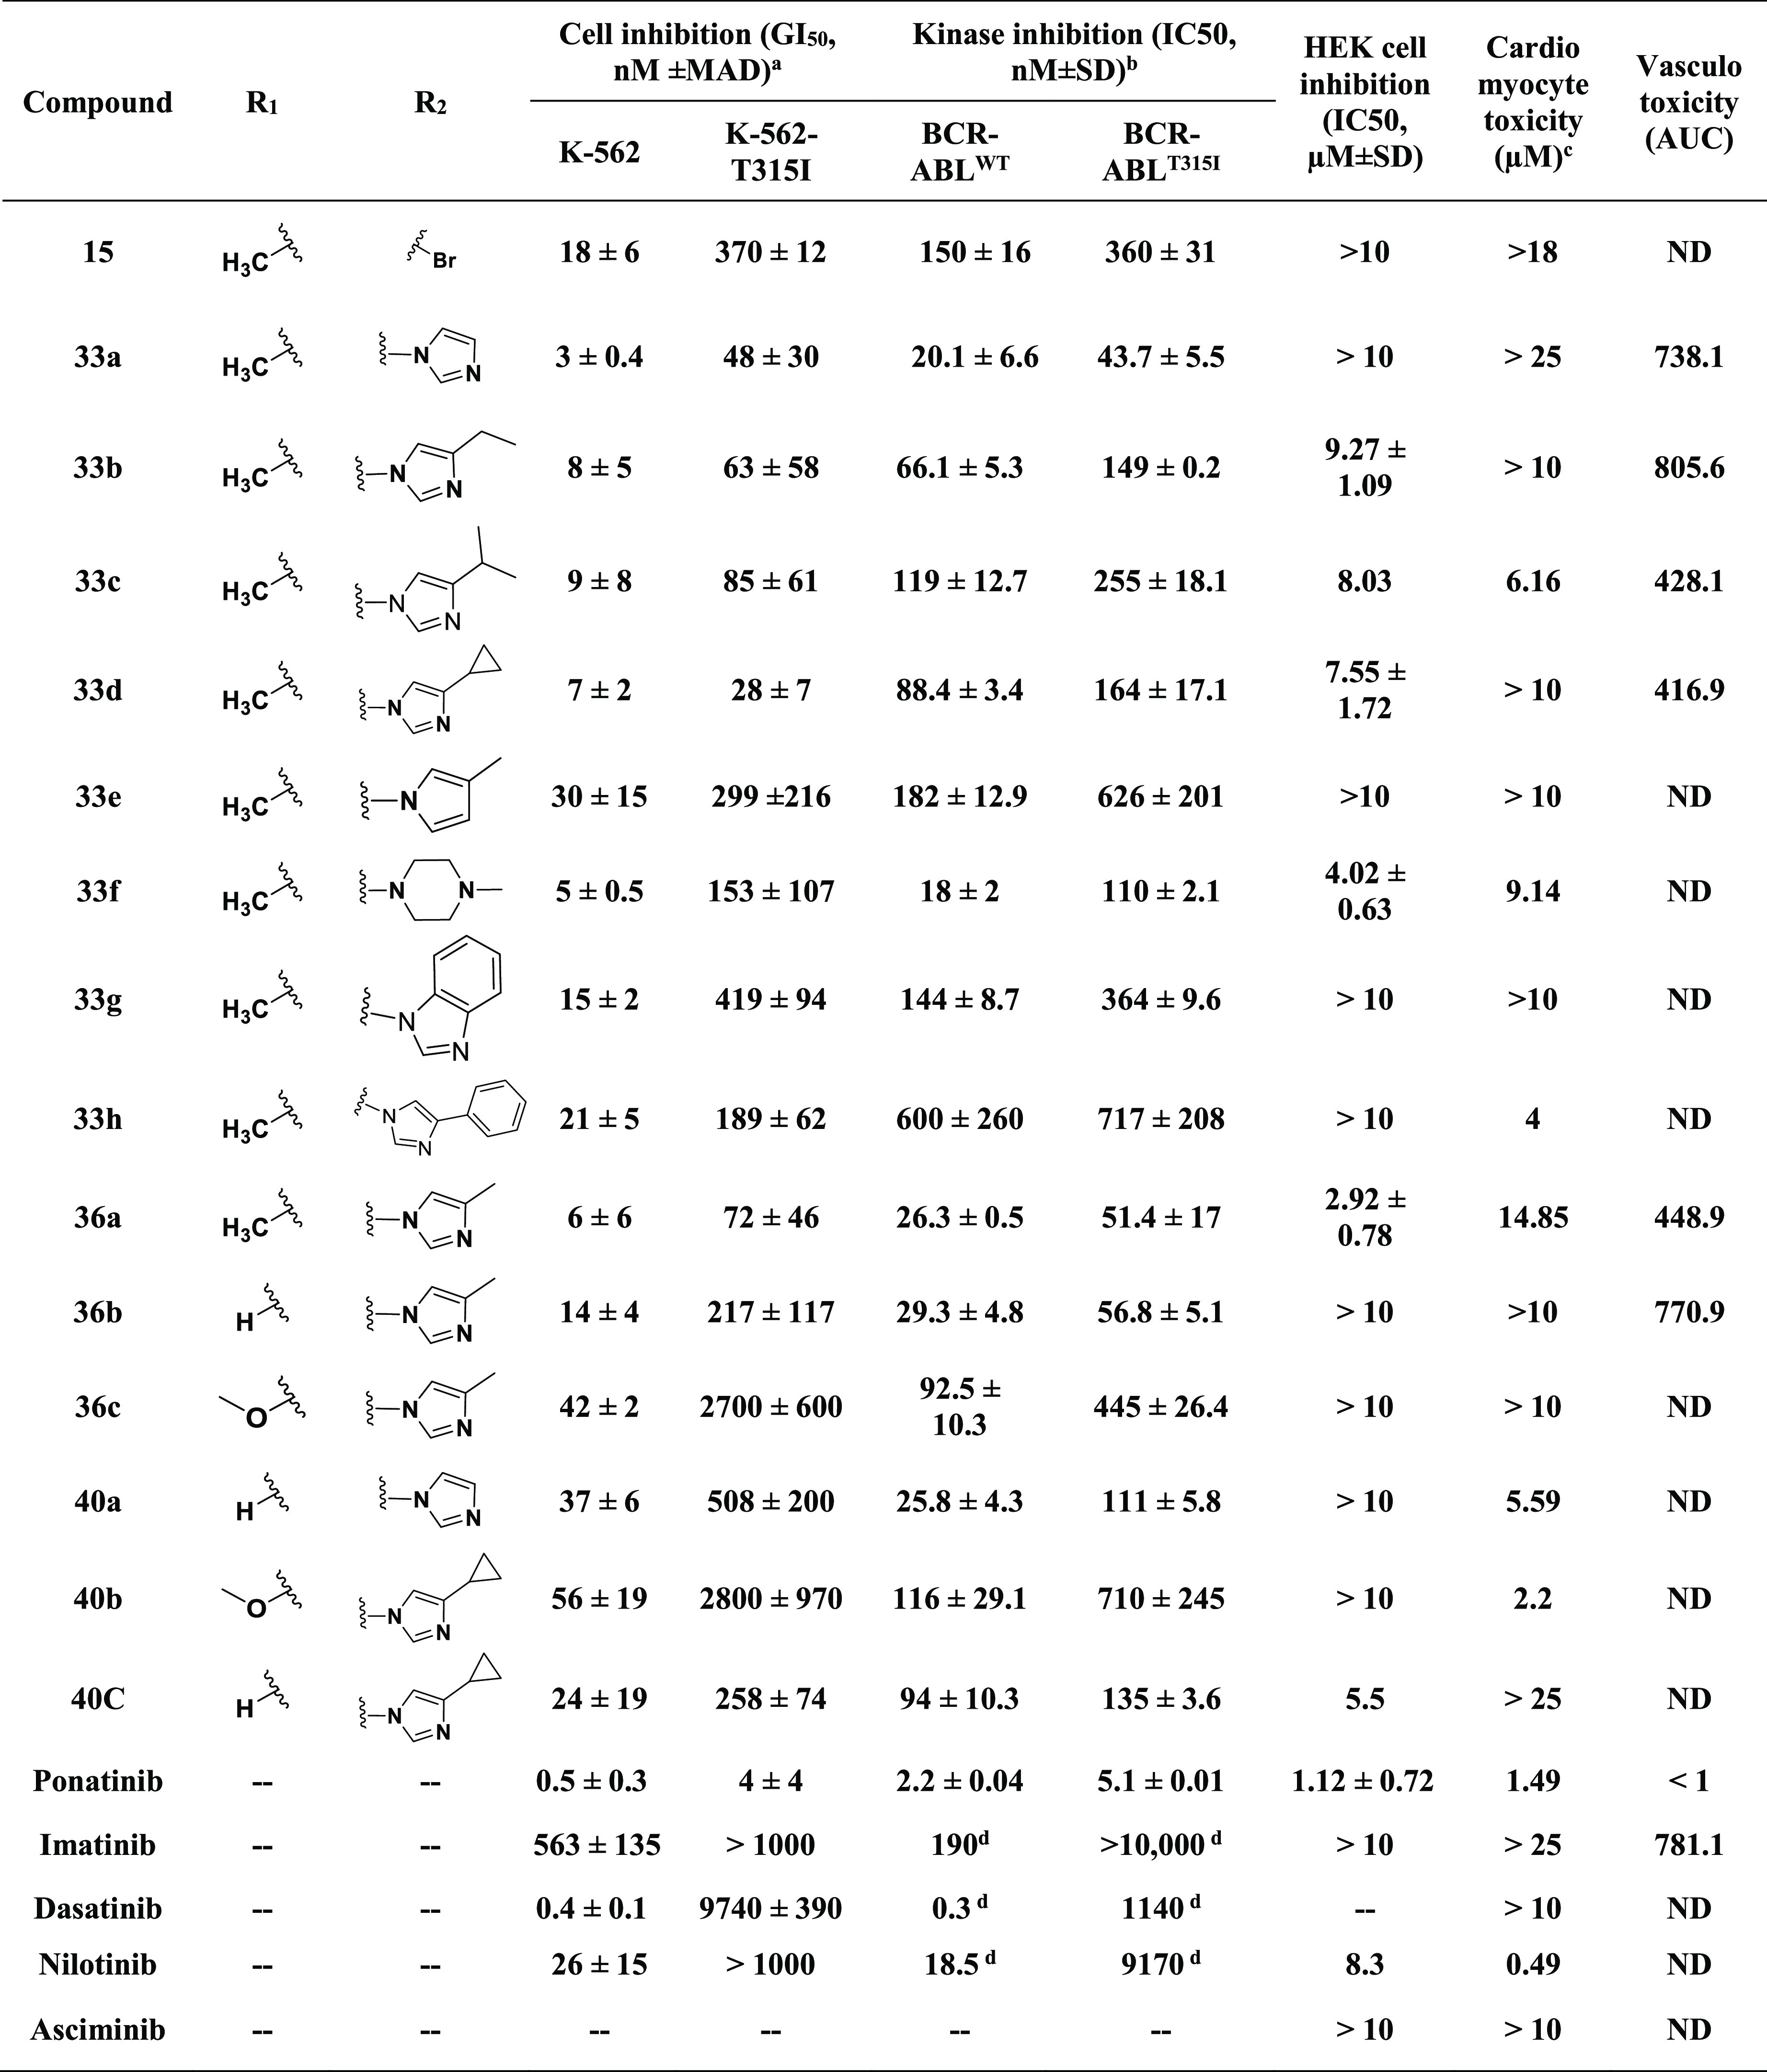
a
GI50 values are shown as the median and median absolute deviation (MAD) of at least two independent experiments performed in triplicate.
b
IC50 was determined by following the biochemical kinase assay protocol. The data represent the mean and standard deviation of at least two independent experiments performed in duplicate.
c
Overall smallest toxic dose.
d
Data taken from ref (52).
e
Cell viability in the presence of varying concentrations of compounds was measured by the AlamarBlue assay. HMVEC-Cs were treated with inhibitors, and GI50 values were measured to assess the vasculotoxicity as the AUC (area under the curve) as shown in Figure 6a. ND, no inhibition detected at concentrations of ≤10 μM.