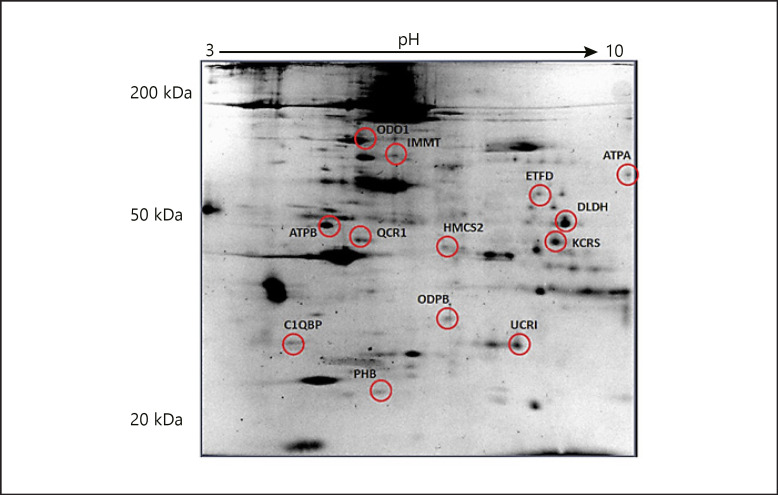
Fig. 3.
Comparative proteome analysis of the patient and the control. Muscle biopsy samples were subjected to mitochondrial protein isolation and loaded onto IPG strips at pH 3 to pH 10 for the first dimension and 12% SDS-PAGE gels for the separation of the second dimension and stained with colloidal Coomassie blue for 24 h after fixation for 24 h. The gel is representative for the selected protein spots and 13 were identified. The gel image was created using PDQuest Advance software to determine the number of spots that differentiated every member. The numbers are the numbers of the identified protein assigned to each spot by the researchers. These spots were cut from the gels and were subjected to MALDI-TOF/TOF analysis. Protein identification was performed by peptide mass fingerprinting by MASCOT.

