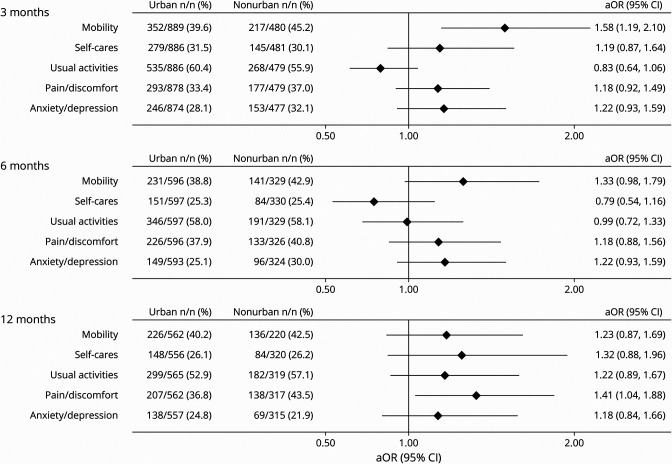
Figure 3. Urban vs Nonurban Quality of Life (EQ-5D-3L): Reporting Any Problems.
aOR = adjusted odds ratio; EQ-5D-3L = EuroQol 5-dimension, 3-level health-related quality of life questionnaire. All outcomes were adjusted for premorbid level independence, age, ethnicity, stroke severity, and baseline characteristic differences of p < 0.1. Covariates were backward eliminated if removal did not substantially affect the odds ratio, aiming to minimize number of covariates and to optimize model fit).

