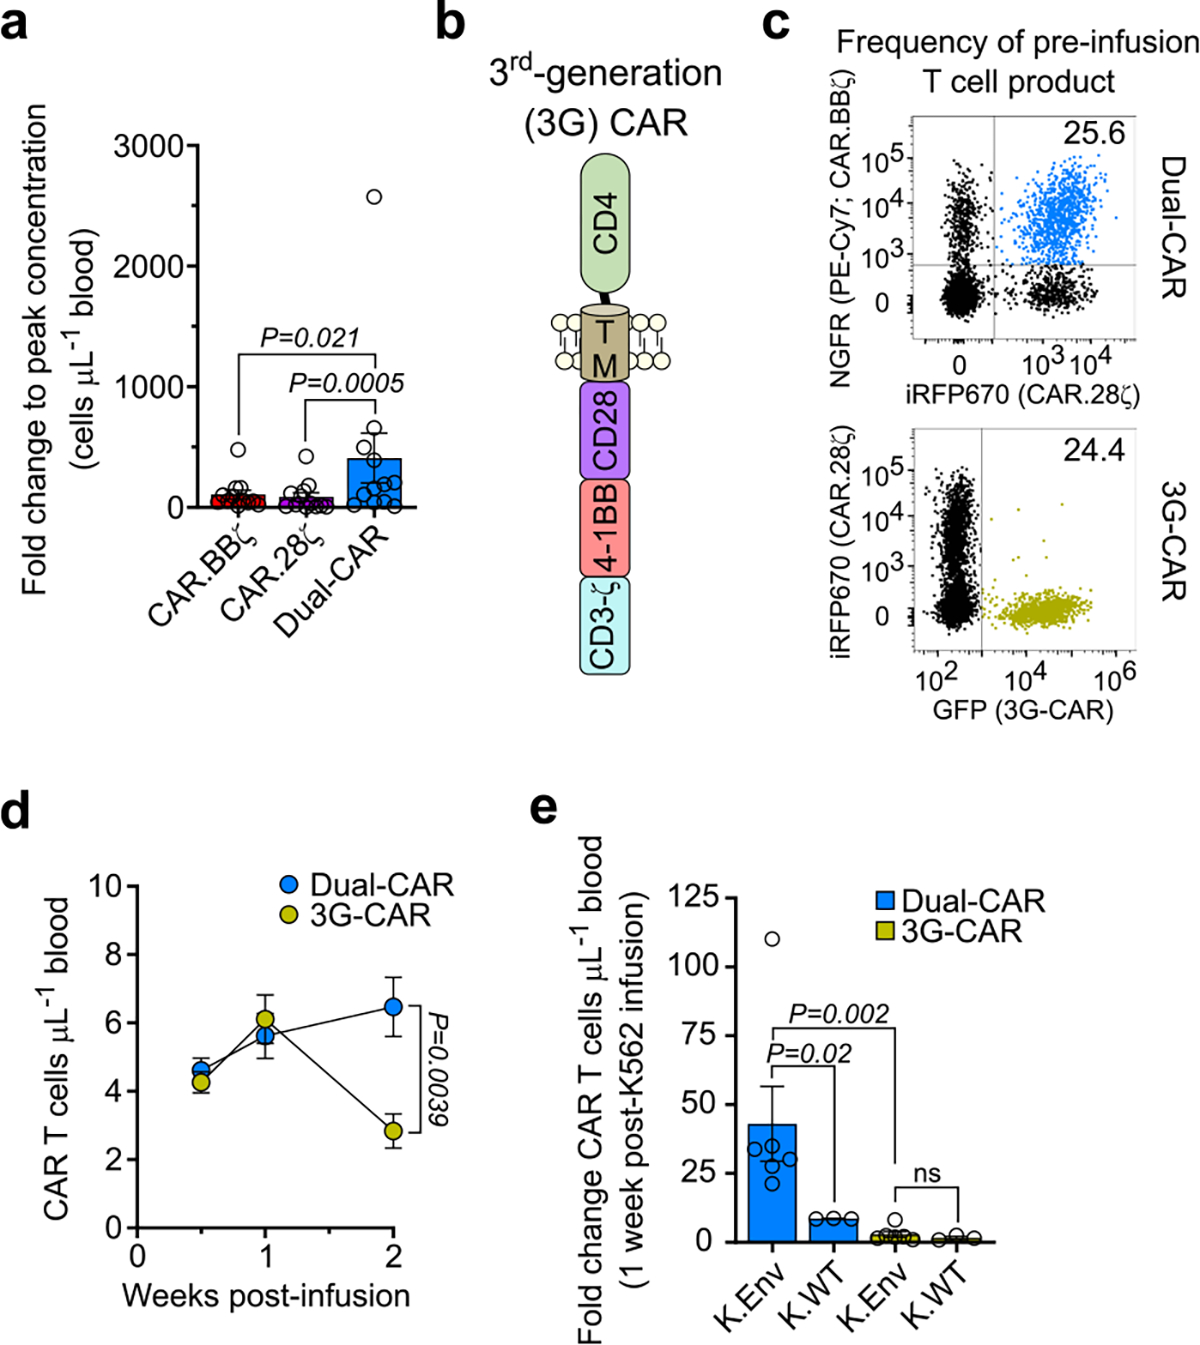
Extended Data Fig. 6 |. Dual-CAR T cells exhibit superior in vivo expansion compared to 4–1BB-costimulated, CD28-costimulated, and 3rd-generation CAR T cells.

a, BLT mice were challenged with either HIVJRCSF (n = 6) or HIVMJ4 (n = 6) and infused with 2×10⁷ Dual-CAR T cell product (TCP). Fold-change in CAR T cell concentration from baseline to peak levels in peripheral blood. Data is the aggregate of both infection cohorts. b, Schematic shows the structural components of the 3rd-generation (3 G) CD4-based CAR construct. c–e, Dual-CAR T cell product and 3G-CAR T cells were combined at an equal frequency prior to infusion into uninfected mice (n = 9). c, FACS plots indicate the frequency of Dual-CAR and 3G-CAR T cells present within the pre-infusion T cell product. d, Longitudinal concentration of peripheral CAR T cells following adoptive transfer into HIV-negative mice. Symbols and error bars indicate mean ± SEM. e, At 2 weeks post-infusion, mice received either 107 irradiated K.Env cells (n = 6) or 107 irradiated K.WT cells (n = 3). Fold change in the concentration of peripheral CAR T cells 1-week post-K562 infusion from baseline concentration prior to K562 infusion. a, e, Bar and error bars indicate mean ± SEM, and symbols represent individual mice. a, d, e, Two-sided Wilcoxon rank-sum test was used to calculate significance. Sample sizes in these studies indicate biologically independent animals.
