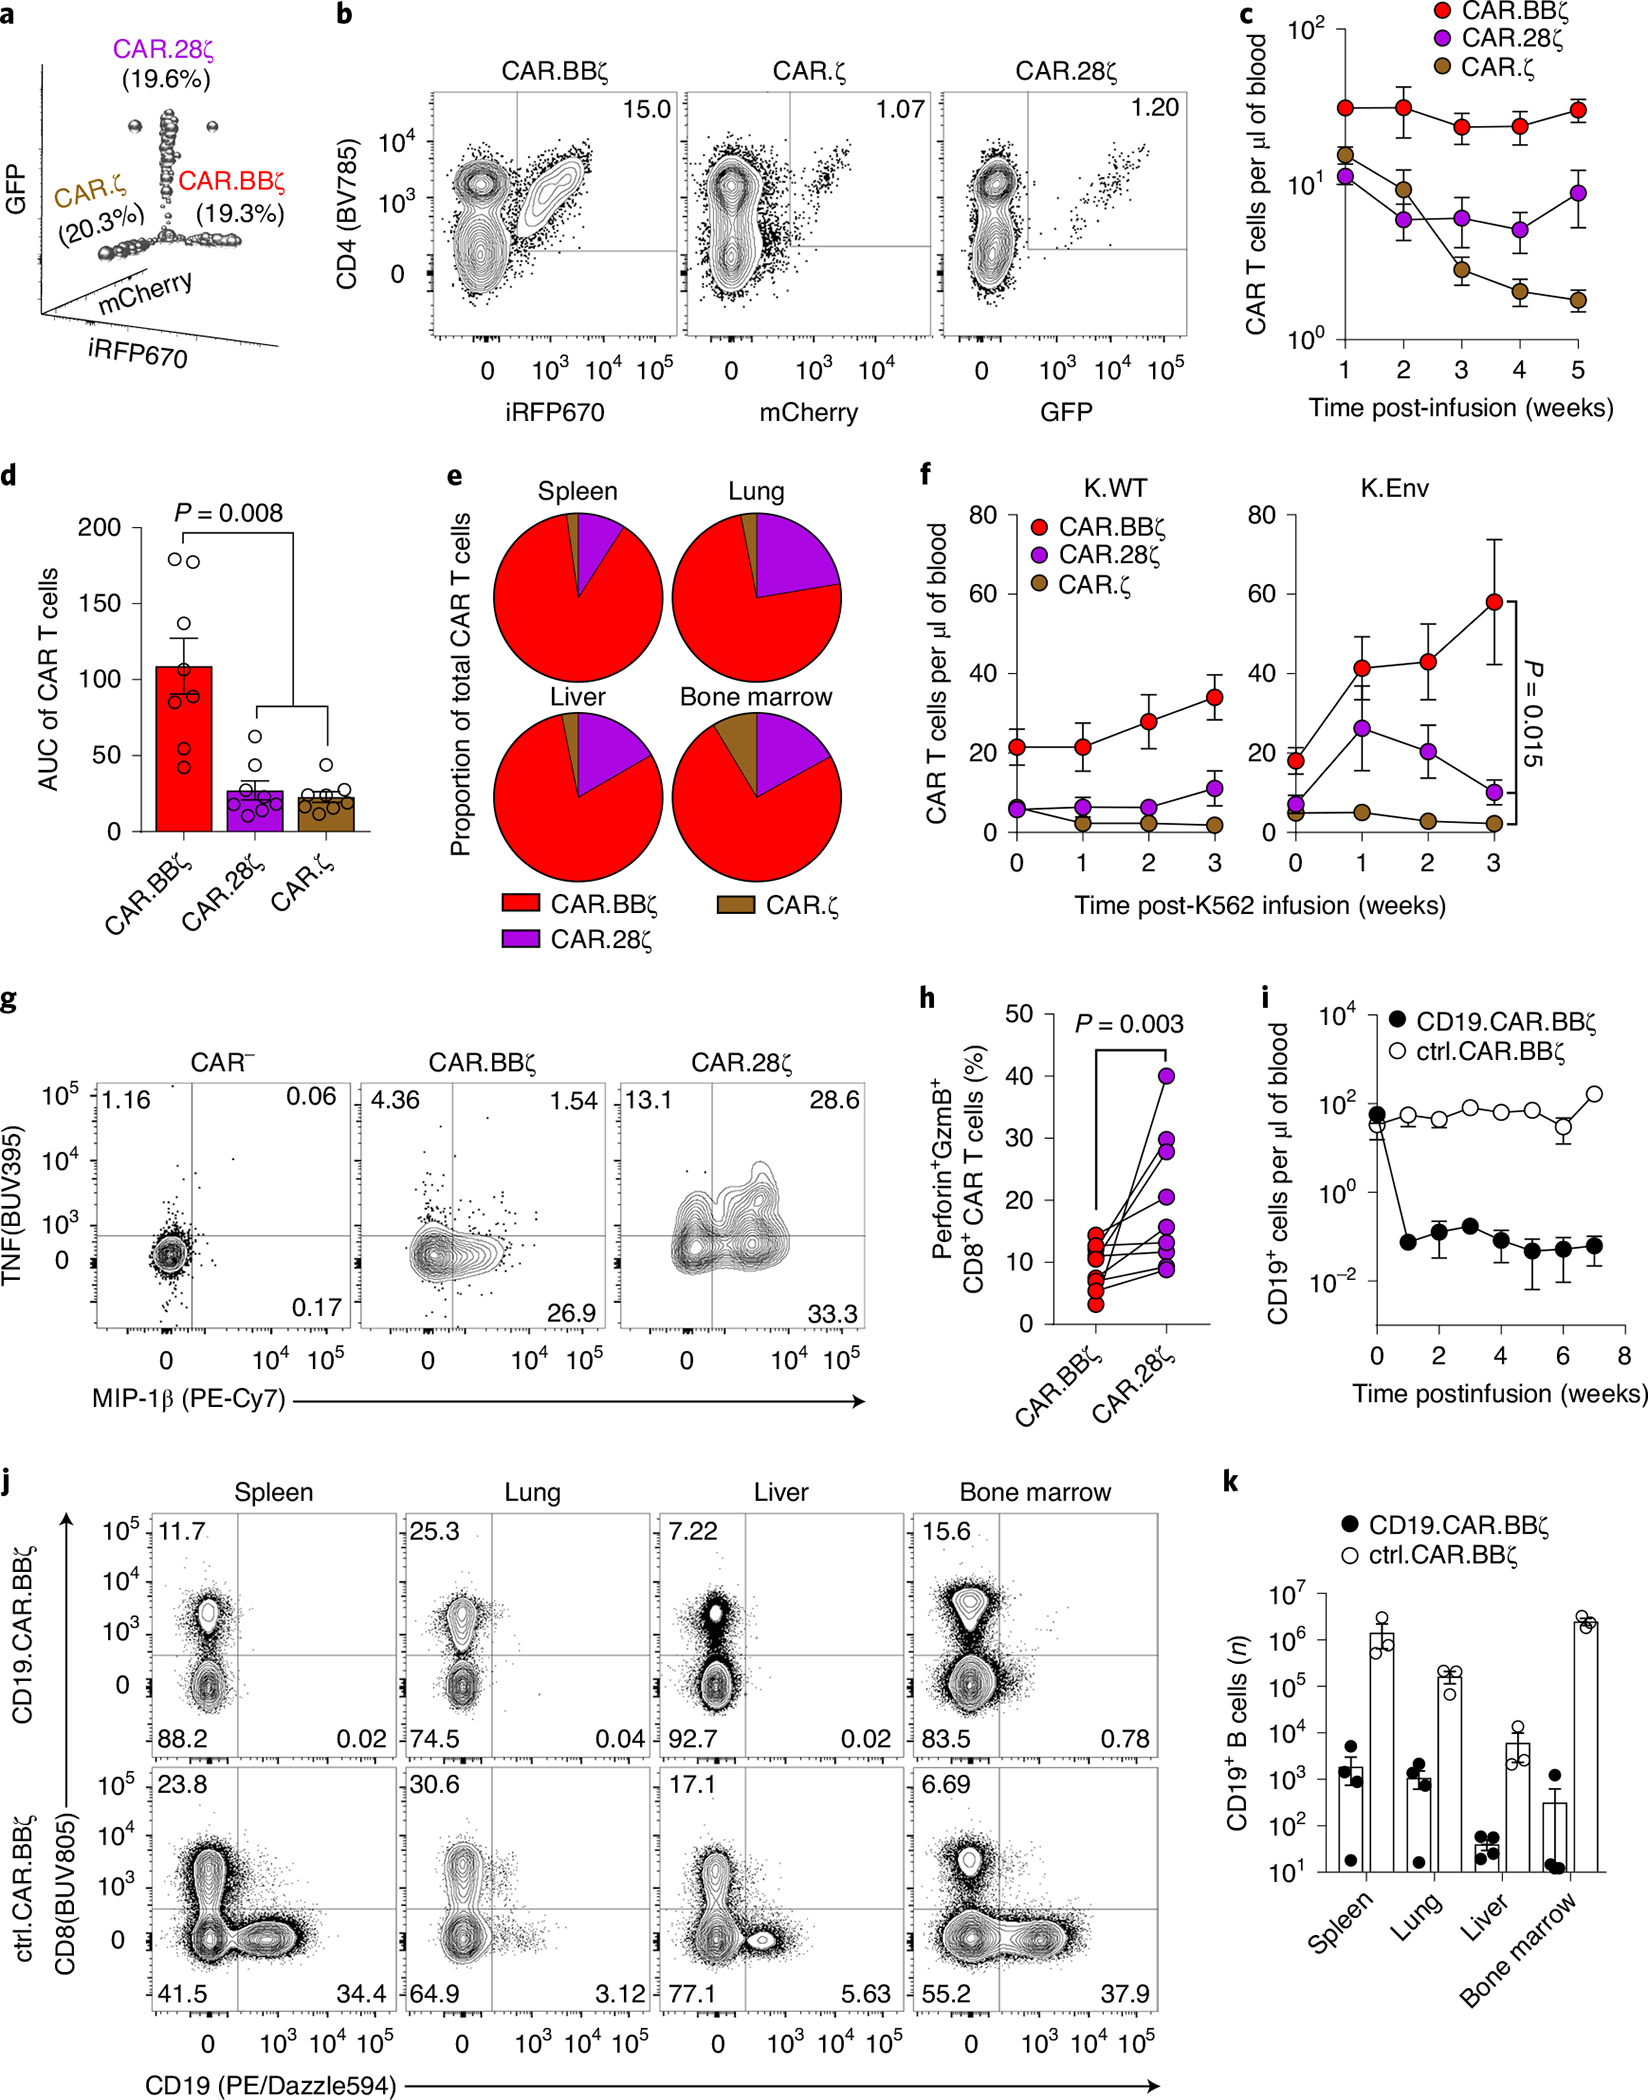
Fig. 2 |. CAR T cells expressing the 4–1BB costimulatory domain exhibit a proliferative advantage and induce B cell aplasia in vivo.

a–e, BLT mouse-derived T cells were transduced with mCherry.T2A.CAR.ζ, iRFP670.T2A.CAR.BBζ or GFP.T2A.CAR.28ζ. In total, 5 × 10⁶ CAR-transduced T cells of each type were mixed before infusion into syngeneic mice (n = 8). a, Frequency of each CAR T cell type within the preinfusion TCP. b, Frequency of peripheral CAR T cells within the same mouse at 5 weeks postinfusion. c,d, Peripheral concentration (c) and cumulative persistence (d) of each CAR T cell type over 5 weeks of engraftment. e, Relative tissue frequency of each CAR T cell type at 7 weeks postinfusion. f, In a separate study, 2 weeks after infusion of the CAR T cell mixture described in a, BLT mice received 107 irradiated K.WT (n = 8) or HIVYU2 Envelope+ (K.Env; n = 8) K562 cells. Peripheral concentration of each CAR T cell type following K.WT or K.Env infusion. g, FACS plots indicating frequency of MIP-1β+ and TNF+ CAR.BBζ and CAR.28ζ T cells within the same mouse after ex vivo stimulation. CAR.ζ T cells were too infrequent for analysis. h, Frequency of granzyme B+ perforin+ CD8+ CAR T cells within the same mice ex vivo. i–k, Mice were infused with 5 × 10⁶ CD19-specific CAR.BBζ (n = 4) or control CD4-based CAR.BBζ T cells (n = 3). i, Concentration of peripheral CD19+ cells following infusion. j,k, FACS plots showing frequency of CD19+ cells (j), and number of CD19+ cells (k) in tissues at 7 weeks postinfusion. For all data, symbols and bars reflect mean and error bars show ±s.e.m., except d and k where symbols represent individual mice. d, Friedman’s test with Dunn’s multiple corrections test. f,h, Two-sided Wilcoxon matched-pairs signed rank test was performed to calculate significance. Sample sizes for all mouse groups indicate biologically independent animals. AUC, area under the curve; ctrl, control.
