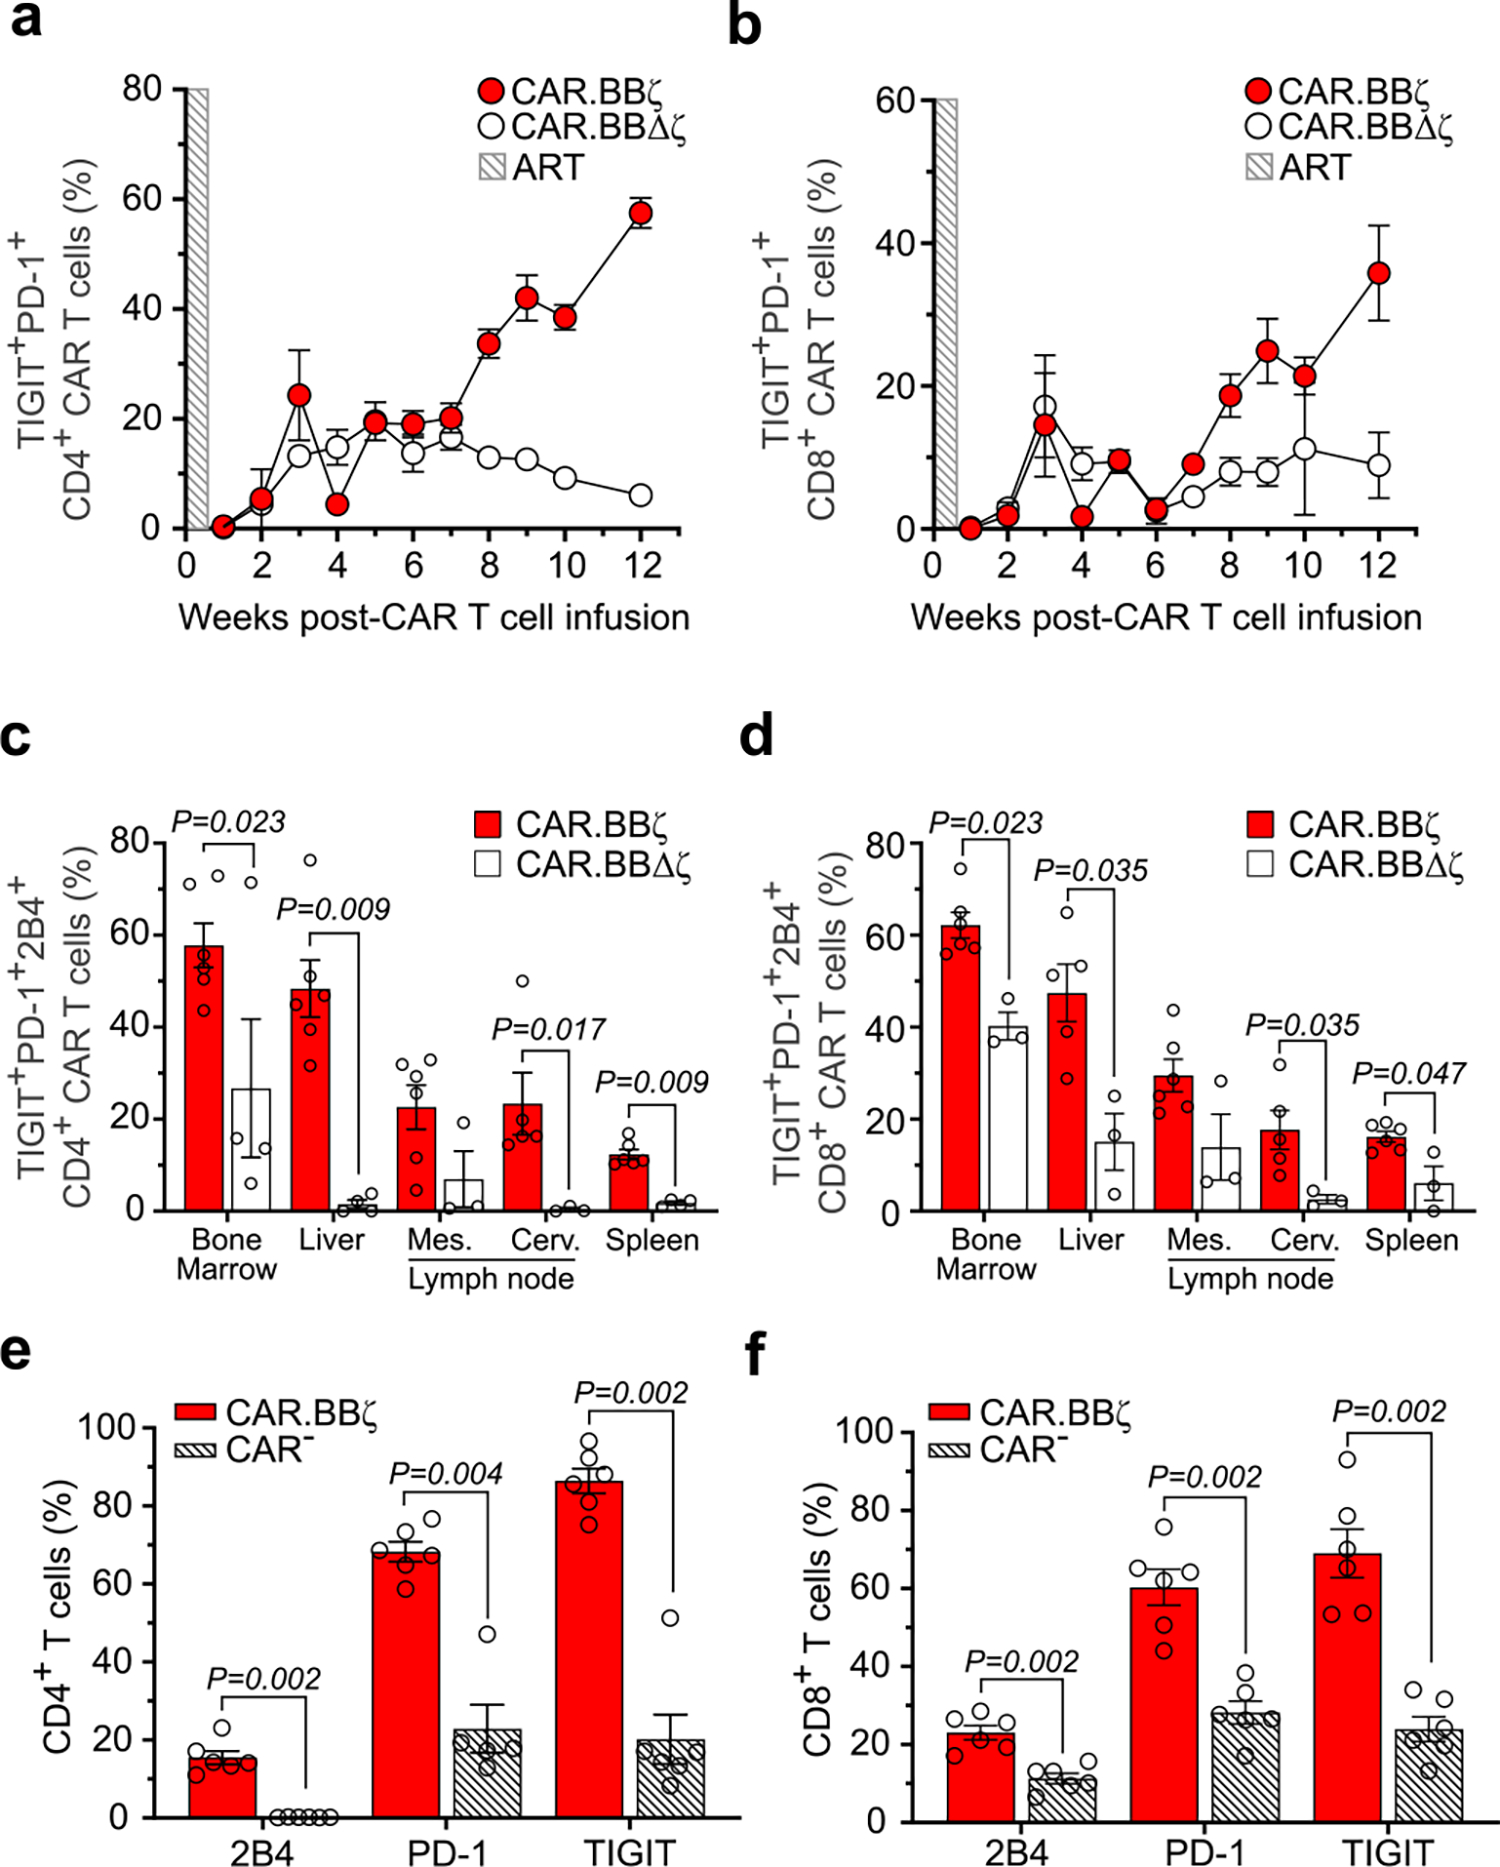
Extended Data Fig. 2 |. CAR.BBζ T cells accumulate multiple inhibitory receptors as disease progresses.

a, Frequency of CD4+ and (b) CD8+ CAR.BBζ T cells (G1; n = 6) and CAR.BBΔζ T cells (G2; n = 6) co-expressing TIGIT and PD-1 after infusion. Shaded box indicates the window of ART. Symbols and error bars indicate mean ± SEM. c, Frequency of CD4+ and (d) CD8+ CAR.BBζ T cells (G1) and CAR.BBΔζ T cells (G2) co-expressing TIGIT, PD-1 and 2B4 in tissues 12 weeks post-infusion. e, Cumulative data indicating the frequency of 2B4+, PD-1+ and TIGIT+ CD4+ CAR.BBζ T cells (G1) compared to CAR− CD4+ T cells (G1) within the spleens of the same mice, and (f) CD8+ CAR.BBζ T cells (G1) compared to CAR− CD8+ T cells (G1) within the spleens of the same mice. c–f, Bars indicate mean, error bars show ± SEM and symbols represent individual mice. Significance was calculated using two-sided Wilcoxon rank-sum test. Sample sizes in these studies represent biologically independent animals.
