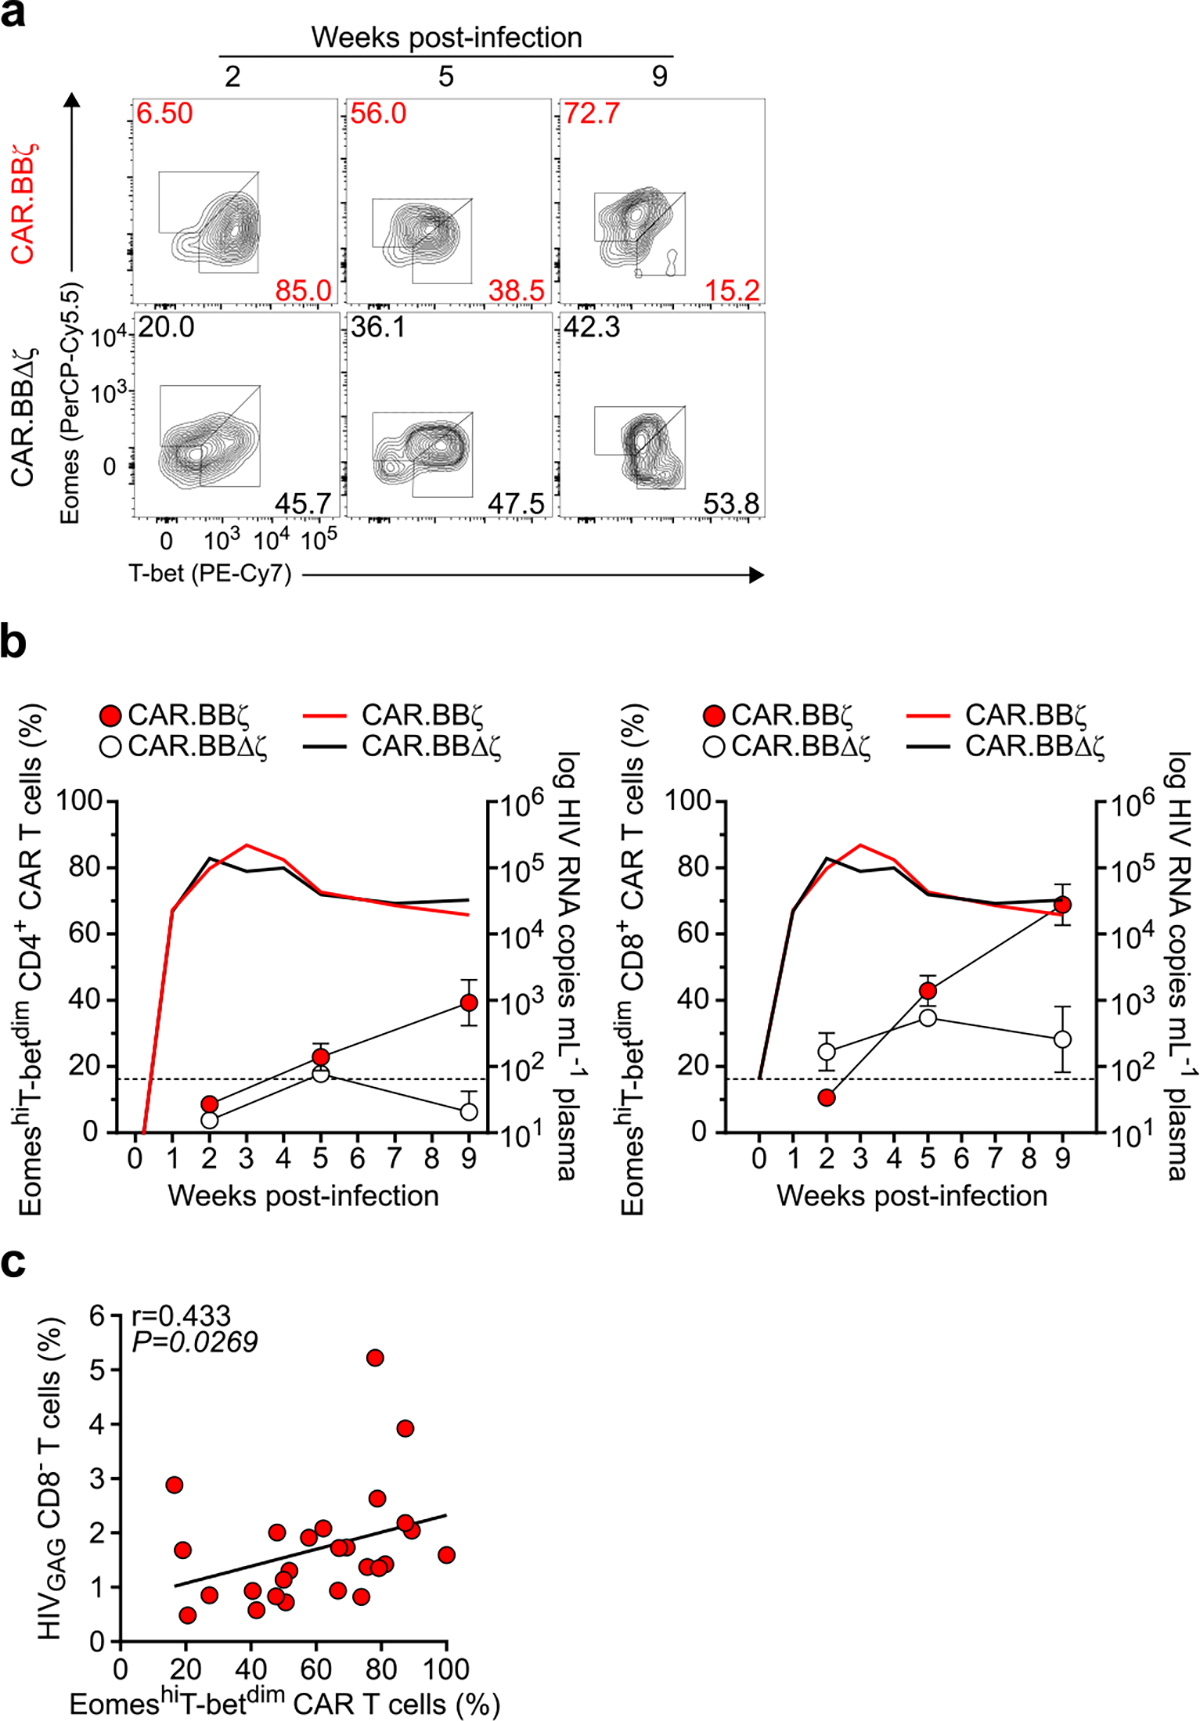
Extended Data Fig. 3 |. eomeshiT-betdim CAR.BBζ T cells accumulate from acute to chronic phases of infection.

BLT mice were infected with HIVJRCSF and infused 48 h later with either 2×10⁷ CAR.BBζ T cells (n = 5) or inactive control CAR.BBΔζ T cells (n = 3). a, FACS plots show the change in Eomes and T-bet expression within the different CAR T cell types over time. b, Summary data indicating the longitudinal frequency of EomeshiT-betdim CD8+ (left panel) and CD4+ (right panel) CAR T cells (left y-axis), and mean log plasma HIV RNA (copies mL−1) (right y-axis). Thin dotted line denotes limit of viral load quantification. Symbols and error bars indicate mean ± SEM. c, Spearman correlation analysis of frequency of EomeshiT-betdim CD8+ CAR.BBζ T cells compared with viral burden measured as the frequency of HIVGAG+ CD8− T cells in various tissues 10 weeks post-infection. Sample sizes in these studies indicate biologically independent animals.
