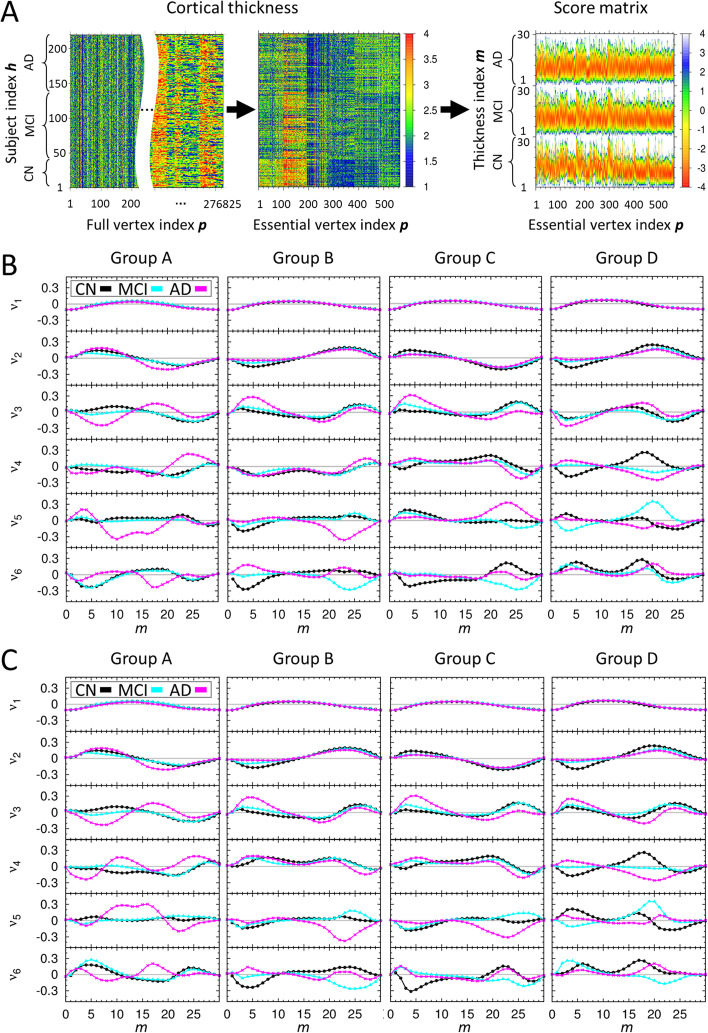
Fig. 2.
The character of score matrix for each group of average cortical thickness. A For a given group of average cortical thickness, three kinds of heat maps illustrate the process starting from the cortical thickness matrix at all 276,825 vertices to that at only 564 essential ROI vertices, and then construction of the score matrix. The dimension in the x-axis of the cortical thickness matrix at all 276,825 is too large to draw, we placed the blank in the middle to abbreviate the large dimension of the x-axis. B The results of singular value decomposition analysis on score matrices, which are composed of 547 CN, 722 MCI, 247 AD human brain images and used for self-recognition test. For each group of average cortical thickness, six singular vectors corresponding to the six largest singular values are presented. Here, x-axis is m value defined in the third section of methods, and y-axis is an arbitrary unit for the singular vectors. For each graph, the singular vector components for CN, MCI, and AD subjects are plotted by black, cyan, magenta colors, respectively. C The results of singular value decomposition analysis on score matrices, which are composed of 363 CN, 480 MCI, 163 AD human brain images as a training set and used for the first iteration of the stratified threefold cross validation test. The other results of that used for the second and third iterations of the stratified threefold cross validation test are presented in Additional file 1: Fig. S3

