
Fig. 3.
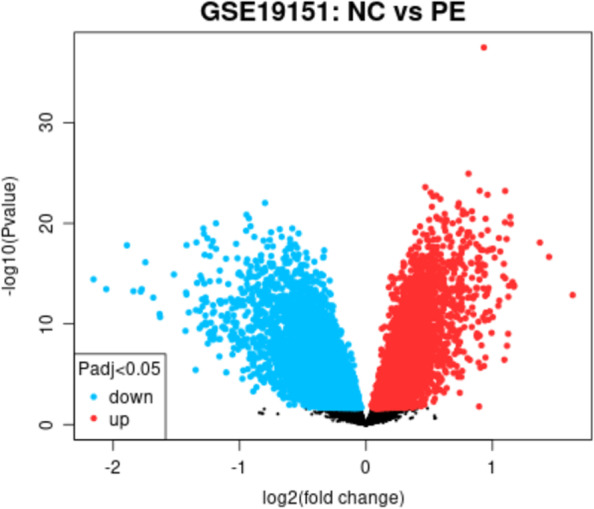
Heat map of differentially expressed genes between patients with pulmonary embolism and healthy control individuals. GSE19151, a dataset of microarray expression profiles downloaded from GEO, contained 10 pulmonary embolism samples and 7 healthy subjects. To analyze pulmonary embolism and differentially expressed genes (DEGs) among healthy people, we used GEO2R as a GEO analysis tool (https://www.ncbi.nlm.nih.gov/geo/geo2r/). We output the results into a heat map, where blue represents upregulated expression and green represents downregulated expression