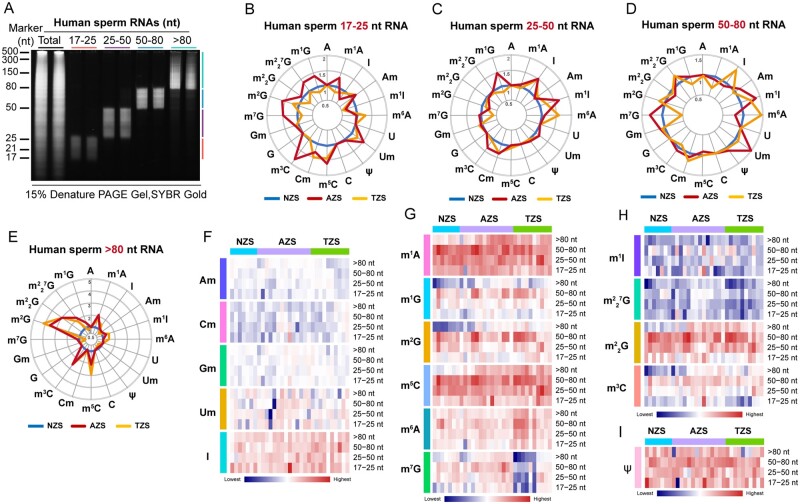
Figure 2.
The RNA modification signature of human sperm RNAs. (A) Sperm total RNA and RNA fragments of nucleotide length >80, 50–80, 25–50 and 17–25 nt after polyacrylamide gel electrophoresis (PAGE) on a 15% urea-polyacrylamide gel, stained with SYBR GOLD. (B–E) The radar graphs show the alteration of RNA modification abundance in human sperm RNA fragments of 17–25 nt (B), 25–50 nt (C), 50–80 nt (D) and >80 nt (E) among NZS (n = 7), AZS (n = 15) and TZS (n = 10) samples. The axes in the radar graphs represent the fold change in RNA modification level in AZS or TZS samples compared to NZS samples; (F–I) the heatmaps show the abundance of RNA modification marks, such as Am Cm Gm Um and I in (F), m1A, m1G, m2G, m5C, m6A and m7G in (G), m1I, 7G, G and m3C in (H) and Ψ in (I), in NZS (n = 7), AZS (n = 15) and TZS (n = 10) groups. NZS, Normozoospermia; AZS, Asthenozoospermia; TZS, Teratozoospermia. The uncropped gel for Fig. 2A is shown in Supplementary Fig. S9.

