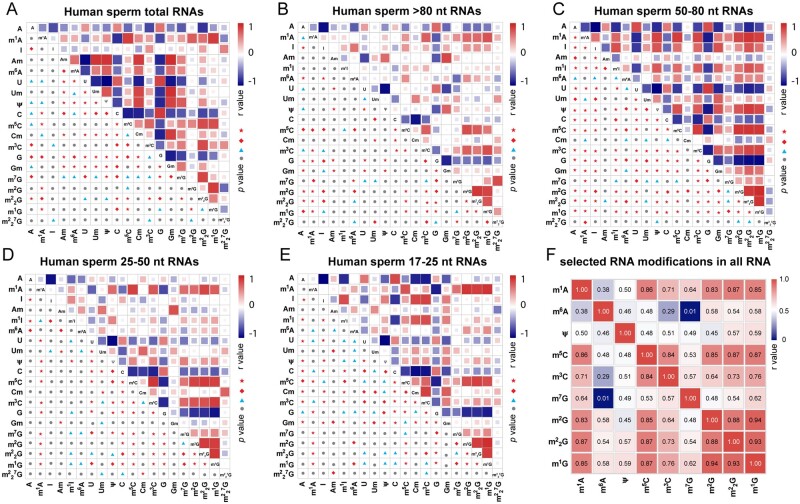
Figure 3.
Correlation analysis between the abundance of different RNA modification marks on human sperm total RNA and RNA fragments of different sizes. (A–E) Pearson correlation analysis for the abundance of different RNA modification marks on (A) sperm total RNAs (n = 17), (B) sperm RNA fragments >80 nt (n = 32), (C) sperm RNA fragments 50-80 nt (n = 32), (D) sperm RNA fragments 25–50 nt (n = 32) and (E) sperm RNA fragments 17–25 nt (n = 32). (F) Pearson correlation analysis for the abundance of selected RNA modification marks on total RNA and RNA fragments of different sizes (n = 145: total number of RNA modification results used in the correlation analysis). Pearson correlation coefficients were computed with GraphPad Prism 8, and Pearson r values are presented by heatmaps. The P values in (A–E) are shown on each cell as follows: ●, not significant; ▲, P < 0.05; ◆, P < 0.01; ★, P < 0.001. The detailed r values in (F) are presented in each cell.

