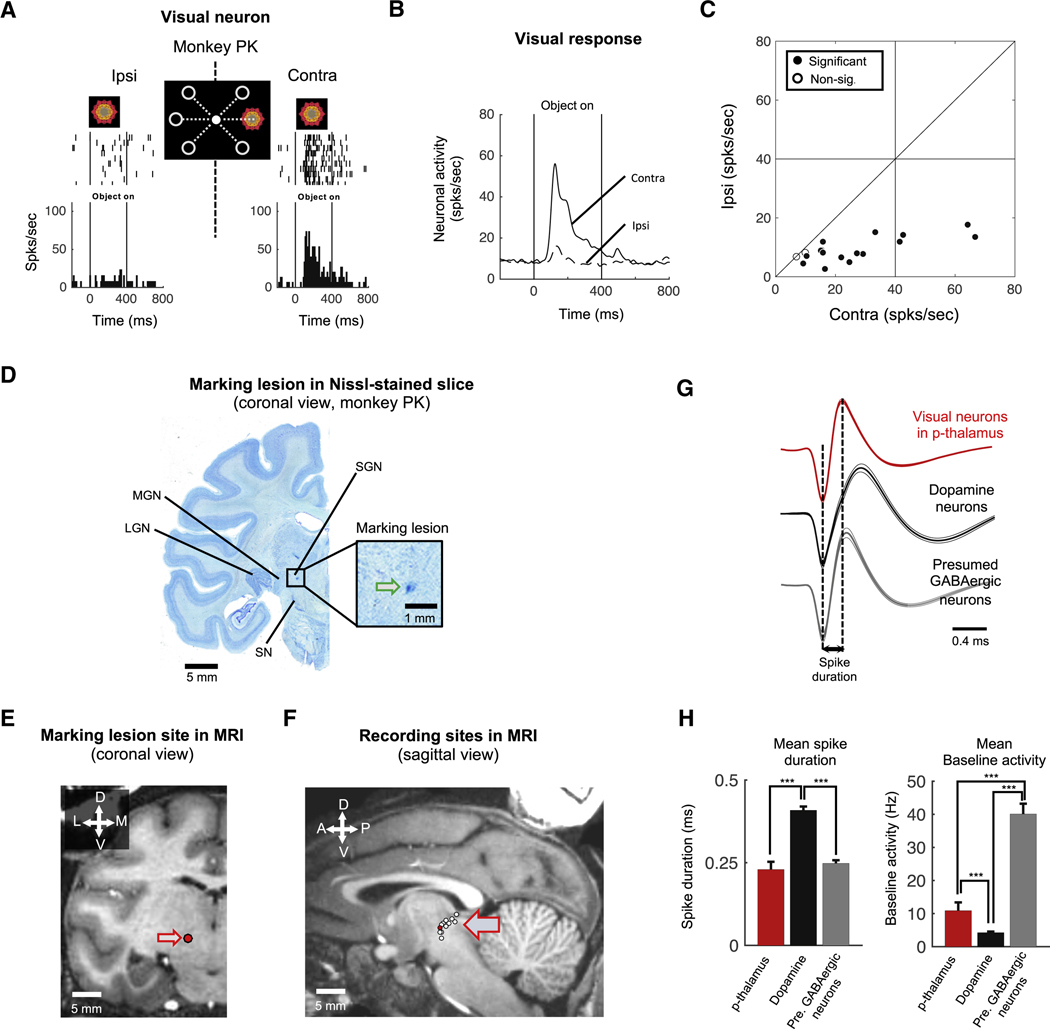
Figure 1. Visually responsive posterior thalamus neurons.
A. Visual response of an example neuron in the p-thalamus of monkey PK. The example neuron showed stronger responses to a fractal object presented in the contralateral visual hemifield than in the ipsilateral hemifield. B. Population response of visual neurons (n = 17). Neurons in the p-thalamus more strongly responded to contralateral visual stimuli than ipsilateral stimuli. C. Spatial selectivity of visual response. Each data point indicates the responses of a neuron to ipsilateral (ordinate) and contralateral (abscissa) objects. Filled dots indicate neurons whose spatial selectivity is statistically significant (Wilcoxon rank-sum test, p < 0.05). Non-sig., non-significant. D. Marking lesion site of the example neuron in figure 1A. The electrical marking lesion indicated the example neuron was dorsal to the substantia nigra and medial to the medial geniculate nucleus in the posterior region of the thalamus (Blue dot indicated by green arrow). SGN: Suprageniculate nucleus, MGN: Medial geniculate nucleus, LGN: Lateral geniculate nucleus, SN: Substantia nigra. E. Marking lesion site in MR image. The marking lesion site was reconstructed in MR image (Red dot indicated by arrow). F. Recording sites of visual neurons in stereotaxic coordinates. Visual neurons were plotted by white dotes on the sagittal MR image. Red dot indicates the position of marking lesion. G-H. Electrophysiological properties. Spike shapes of visual neurons in the p-thalamus, dopamine neurons, and GABAergic neurons in the substantia nigra (G). Bar graphs show mean spike duration and mean baseline activity of each group of neurons (H).

