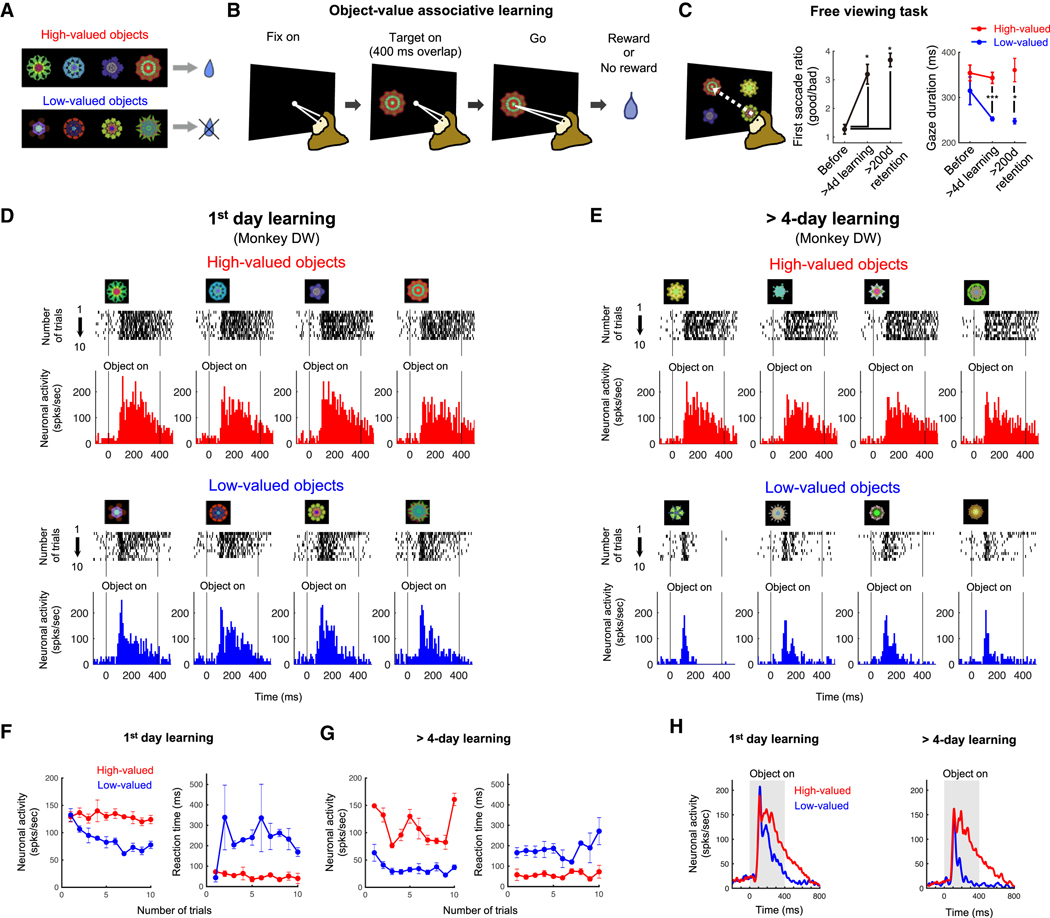
Figure 3. Neural representation of object value during object-value associative learning.
A. Fractal objects associated with a reward (high-valued) or no reward (low-valued). Monkey PK and DW learned 136 and 152 fractal objects, respectively. Among the learned objects, 32 and 80 objects were long-term learned (> 4 days) for each monkey, respectively. B. Object-value associative learning task. A fractal object was presented at a neuron’s preferred position. The monkey made a saccade to it after the central fixation point turned off. Reward or no reward was given depending on the assigned object-value association. A set of 8 objects (as shown in A) was used in each learning session. C. Free viewing task for testing automatic gaze to previously learned objects. Four of eight objects in one set was randomly chosen and presented, and the monkey freely looked around without direct reward outcome. After more than 1-day or 200-days retention time since the last day of long-term learning (>4 learning days), the monkeys showed gaze preference for the high-valued objects (mean ± SE). *p < 0.05 and ***p < 0.0001. D and E. Responses of an example neuron to 8 objects during learning of novel objects and long-term experienced objects. Spike (black ticks) were aligned to object presentation time, and the average responses to 4 high-valued object (red) and 4 low-valued object (blue) were plotted in the histogram graphs. F and G. Value discrimination and saccade reaction time difference during the first learning day and learning of long-term experienced objects. Neuronal activities and saccade reaction times to high-valued (red) and low-valued (blue) objects were plotted against the number of trials. H. Value discrimination activities of the example neuron from Figures 1D-E to the 1-day learned and long-term learned objects during the learning task. Neuronal responses to the high-valued (red) and low-valued (blue) objects were shown using peristimulus time histograms (PSTH). See also Figure S2 and S3.

