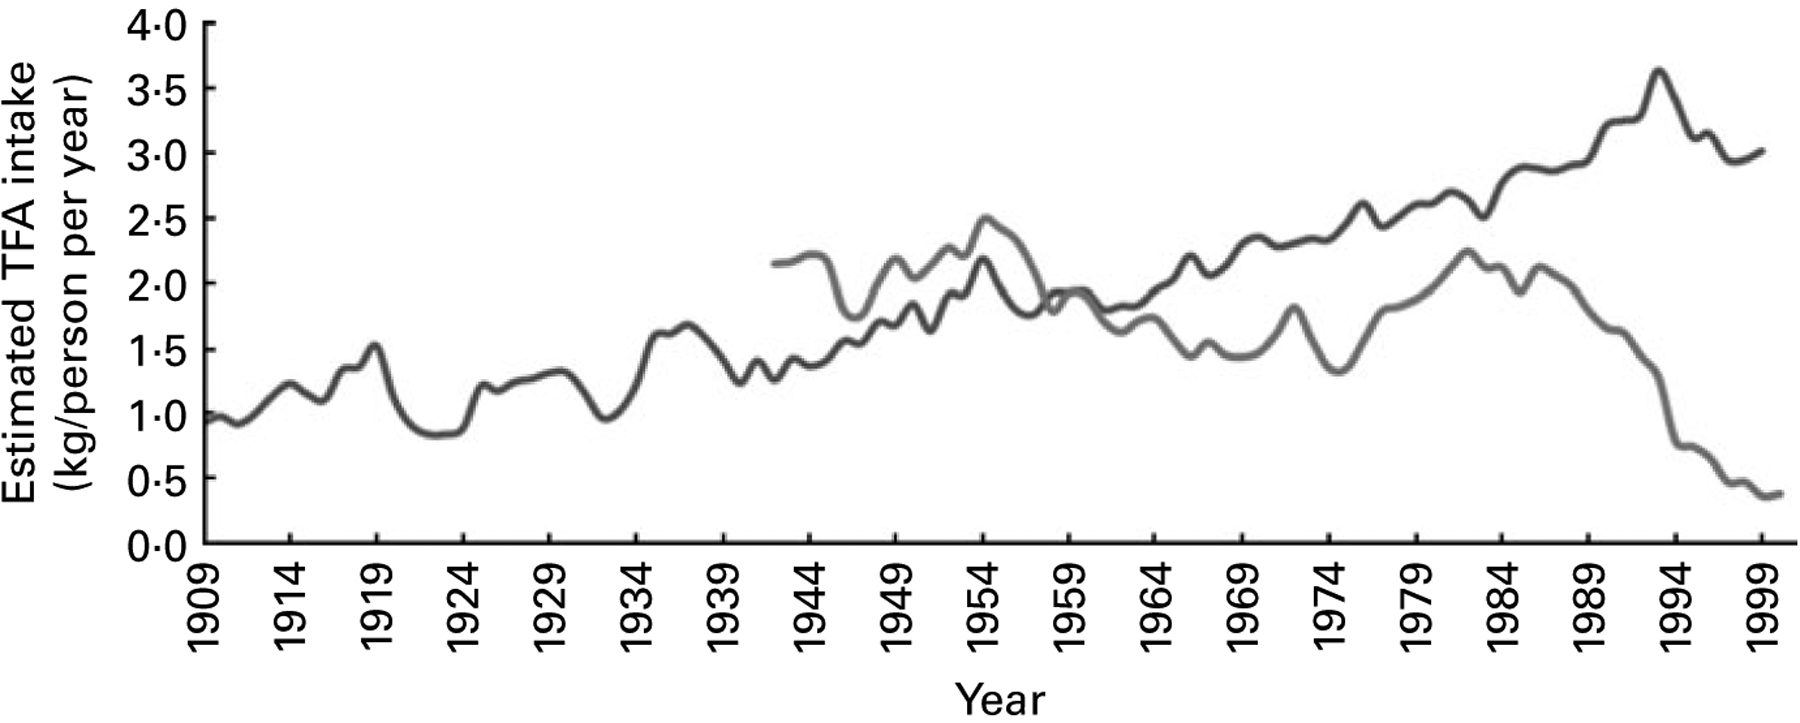
Fig. 6.

Estimation of trans-fatty acid (TFA) consumption in the US and UK control groups. Consumption of TFA in control groups for the US trials was estimated from the historical food commodities disappearance data for margarines and shortenings obtained from the Economic Research Service of the United States Department of Agriculture as per Center for Nutrition Policy and Promotion guidelines (Appendix 1). Consumption of TFA in control groups for the UK trials was estimated from UK National Food Survey data for per capita household margarine use as described in Appendix 1. The UK figures probably underestimate total TFA intake because they do not include data from shortenings, baked goods or fried foods. , TFA from margarines and shortenings, USA 1909–99;
  ,TFA from margarines, UK 1942–2000.
