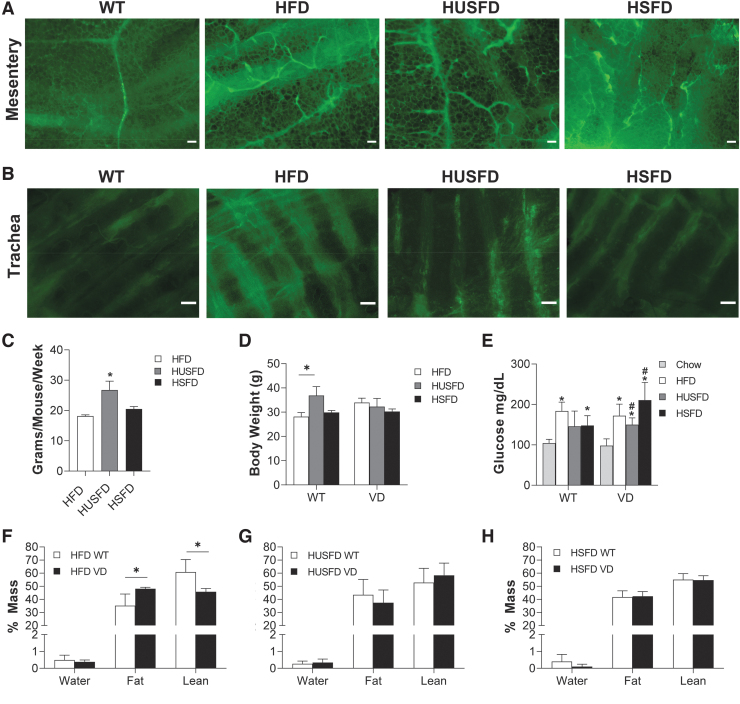
FIG. 2.
Characterization of 2-month dietary fatty acid feeding in VD mice. (A) Immunofluorescence images of mesentery adipose in WT mice and in VD mice under unsaturated fat (HUSFD), standard mixed formulation (HFD), and high saturated fat (HSFD). Green = podoplanin. Scale bars = 200 μM. (B) Immunofluorescence images of lymphatics present in the trachea in WT mice and VD mice under different fat diets. Green = podoplanin. Scale bars = 200 μM. (C) Food consumption over a 1-week period (n = 6 WT, 5 VD). (D) Body weight in WT and VD diet conditions after 8 weeks on diet (n = 6 WT, 5 VD). (E) Five-hour fasted glucose readings recorded before 20% intralipid gavage (n = 4–10 WT, 2–9 VD). (F) End-point body mass percentages of mice at 2 months on chronic HFDs for HFD (n = 7 WT, 4 VD), (G) HUSFD (n = 5 WT, 5 VD), and (H) HSFD (n = 3 WT, 4 VD). *Indicates p < 0.05 compared with WT chow-fed mice; #Indicates p < 0.05 relative to standard HFD for the same genotype.

