Figure 3.
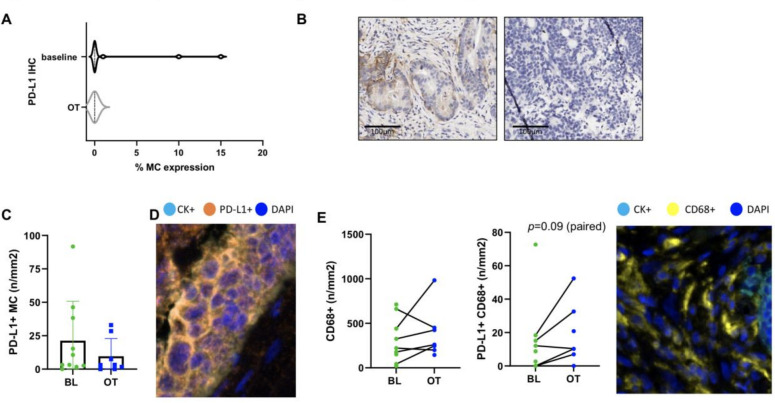
Low PD-L1 expression in the TME prior to therapy and early on-treatment. (A) PD-L1 chromogenic IHC staining at baseline (n=12) and on-treatment (OT) (n=10) as a percentage of malignant cells (MC) with representative images shown in (B). (C) The density of PD-L1+ MCs (n/mm2) as determined using multiplex immunofluorescence staining at baseline (BL) and OT (n=10 BL, 8 OT and 6 pairs). Representative staining is shown in D. (E, F) The density of CD68+ cells and PD-L1+CD68+ cells at BL (green) and OT (blue) is shown respectively with representative staining (n=10 BL, 8 OT and 6 pairs). Statistical comparisons were performed for paired cases only using a paired, parametric t-test. Only one trend was identified and shown. IHC, immunohistochemical; TME, tumor microenvironment.

