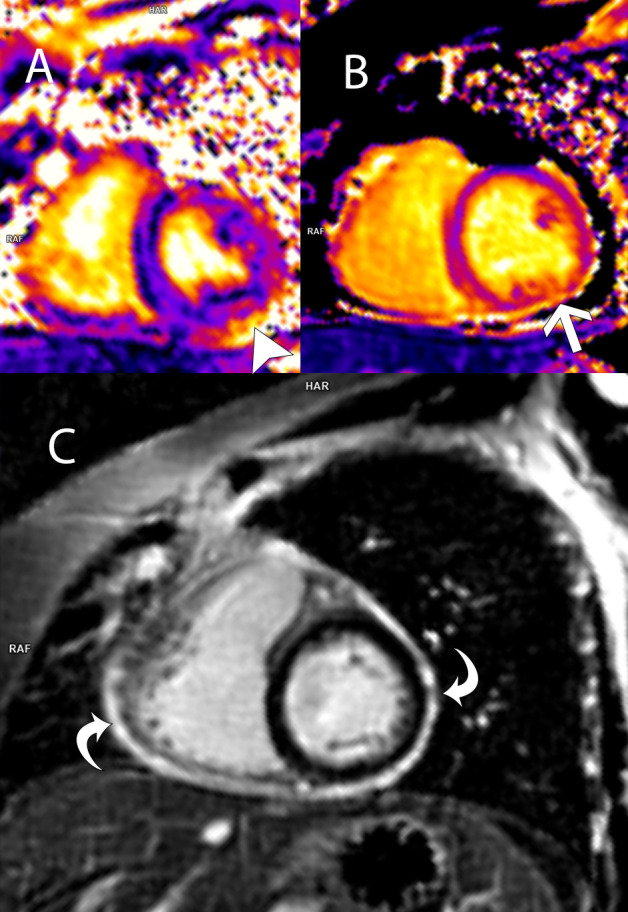
Figure 1.

Cardiac 3 Tesla MRIs oriented in short-axis view at the mid-ventricular level. (A) T2 map shows an increase in myocardial T2 values at 50 ms (arrowhead); (B) T1 map shows elevated myocardial T1 times in the inferolateral segment at 1300 ms (arrow). Findings on T1 and T2 maps indicate myocardial oedema. (C) Phase-sensitive inversion recovery image 10 min after intravenous gadolinium shows diffuse enhancement of the pericardium, consistent with active pericarditis. There is no overt late myocardial enhancement.
