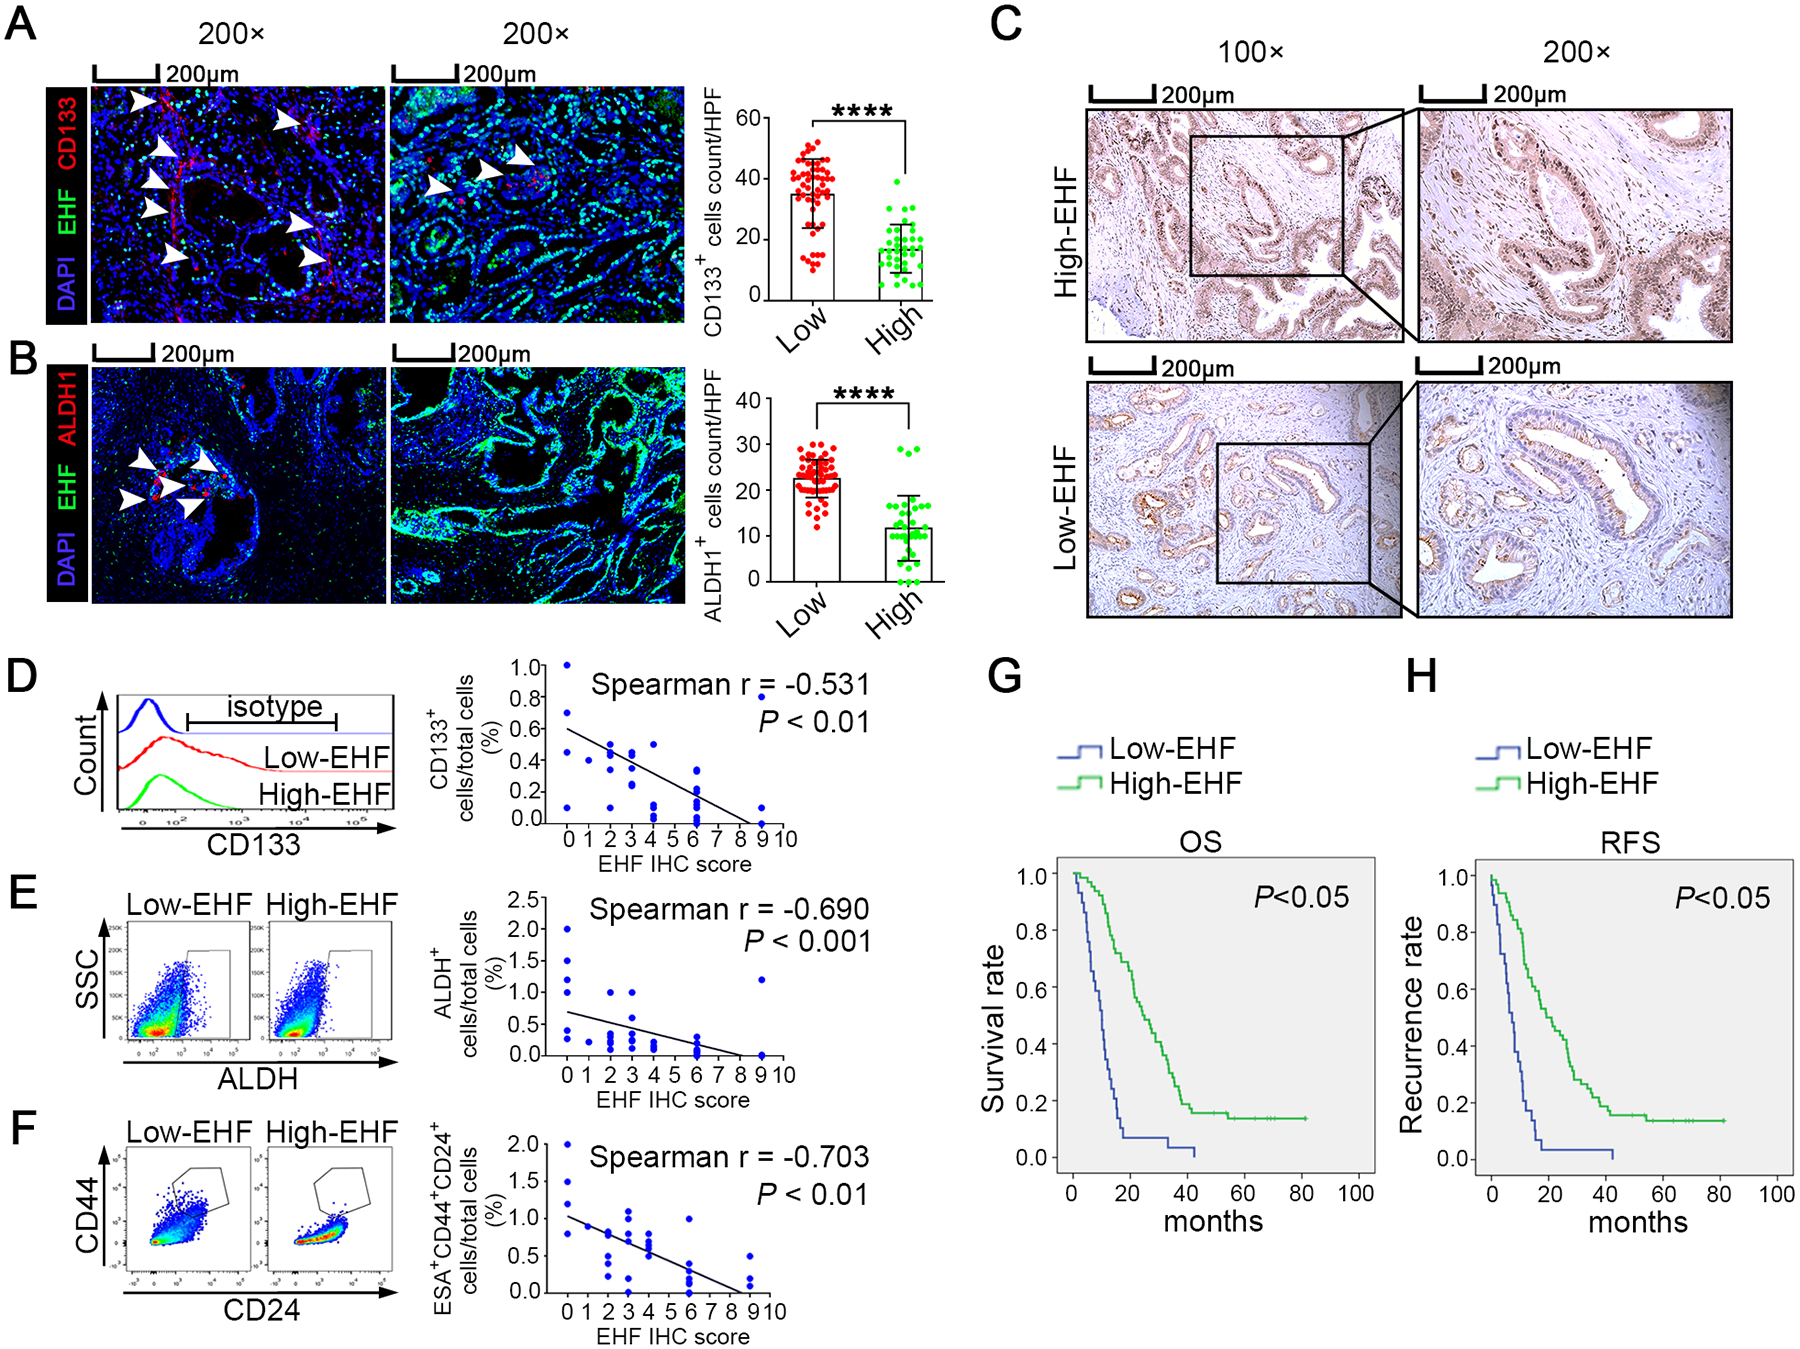
Figure1. Tumoral EHF is negatively correlated with stemness profiles in PDAC tissue.

(A-B) The multiplex fluorescent IHC staining (left) of EHF expression and the accumulation of CD133+ cells (A) and ALDH1+ cells (B) in tumor tissues. The representative images from 93 pancreatic cancer cases were shown. The arrows indicated CD133+ cells and ALDH1+ cells. Bars, 200μM. Nonpaired Student’s t-test was used as statistical analysis; n=93, P<0.0001. (C-F) Single cell suspensions were prepared from 39 cases of fresh PDAC tissues and stained with ALDEFLUOR or specific antibodies against three CSC subsets (ALDH+ cells, CD133+ cells and CD44+ CD24+ cells). Representative IHC staining of EHF was shown(C). Bars, 200μm. Representative histogram and dot plots of CD133+ cells (D, left), ALDH+ cells (E, left) and CD44+CD24+ cells (gated on ESA+ epithelial cells; F, left). Spearman correlation analysis between EHF IHC score and the proportions of CD133+ cells (D, right), ALDH+ cells (E, right) and ESA+CD44+CD24+ cells (F, right); n=39. (G-H) Kaplan-Meier OS (G) and RFS (H) for different levels of EHF based on the log-rank statistic test (P<0.05). Patients were divided into EHF-low and EHF-high groups based on the multiplex fluorescent IHC results.
