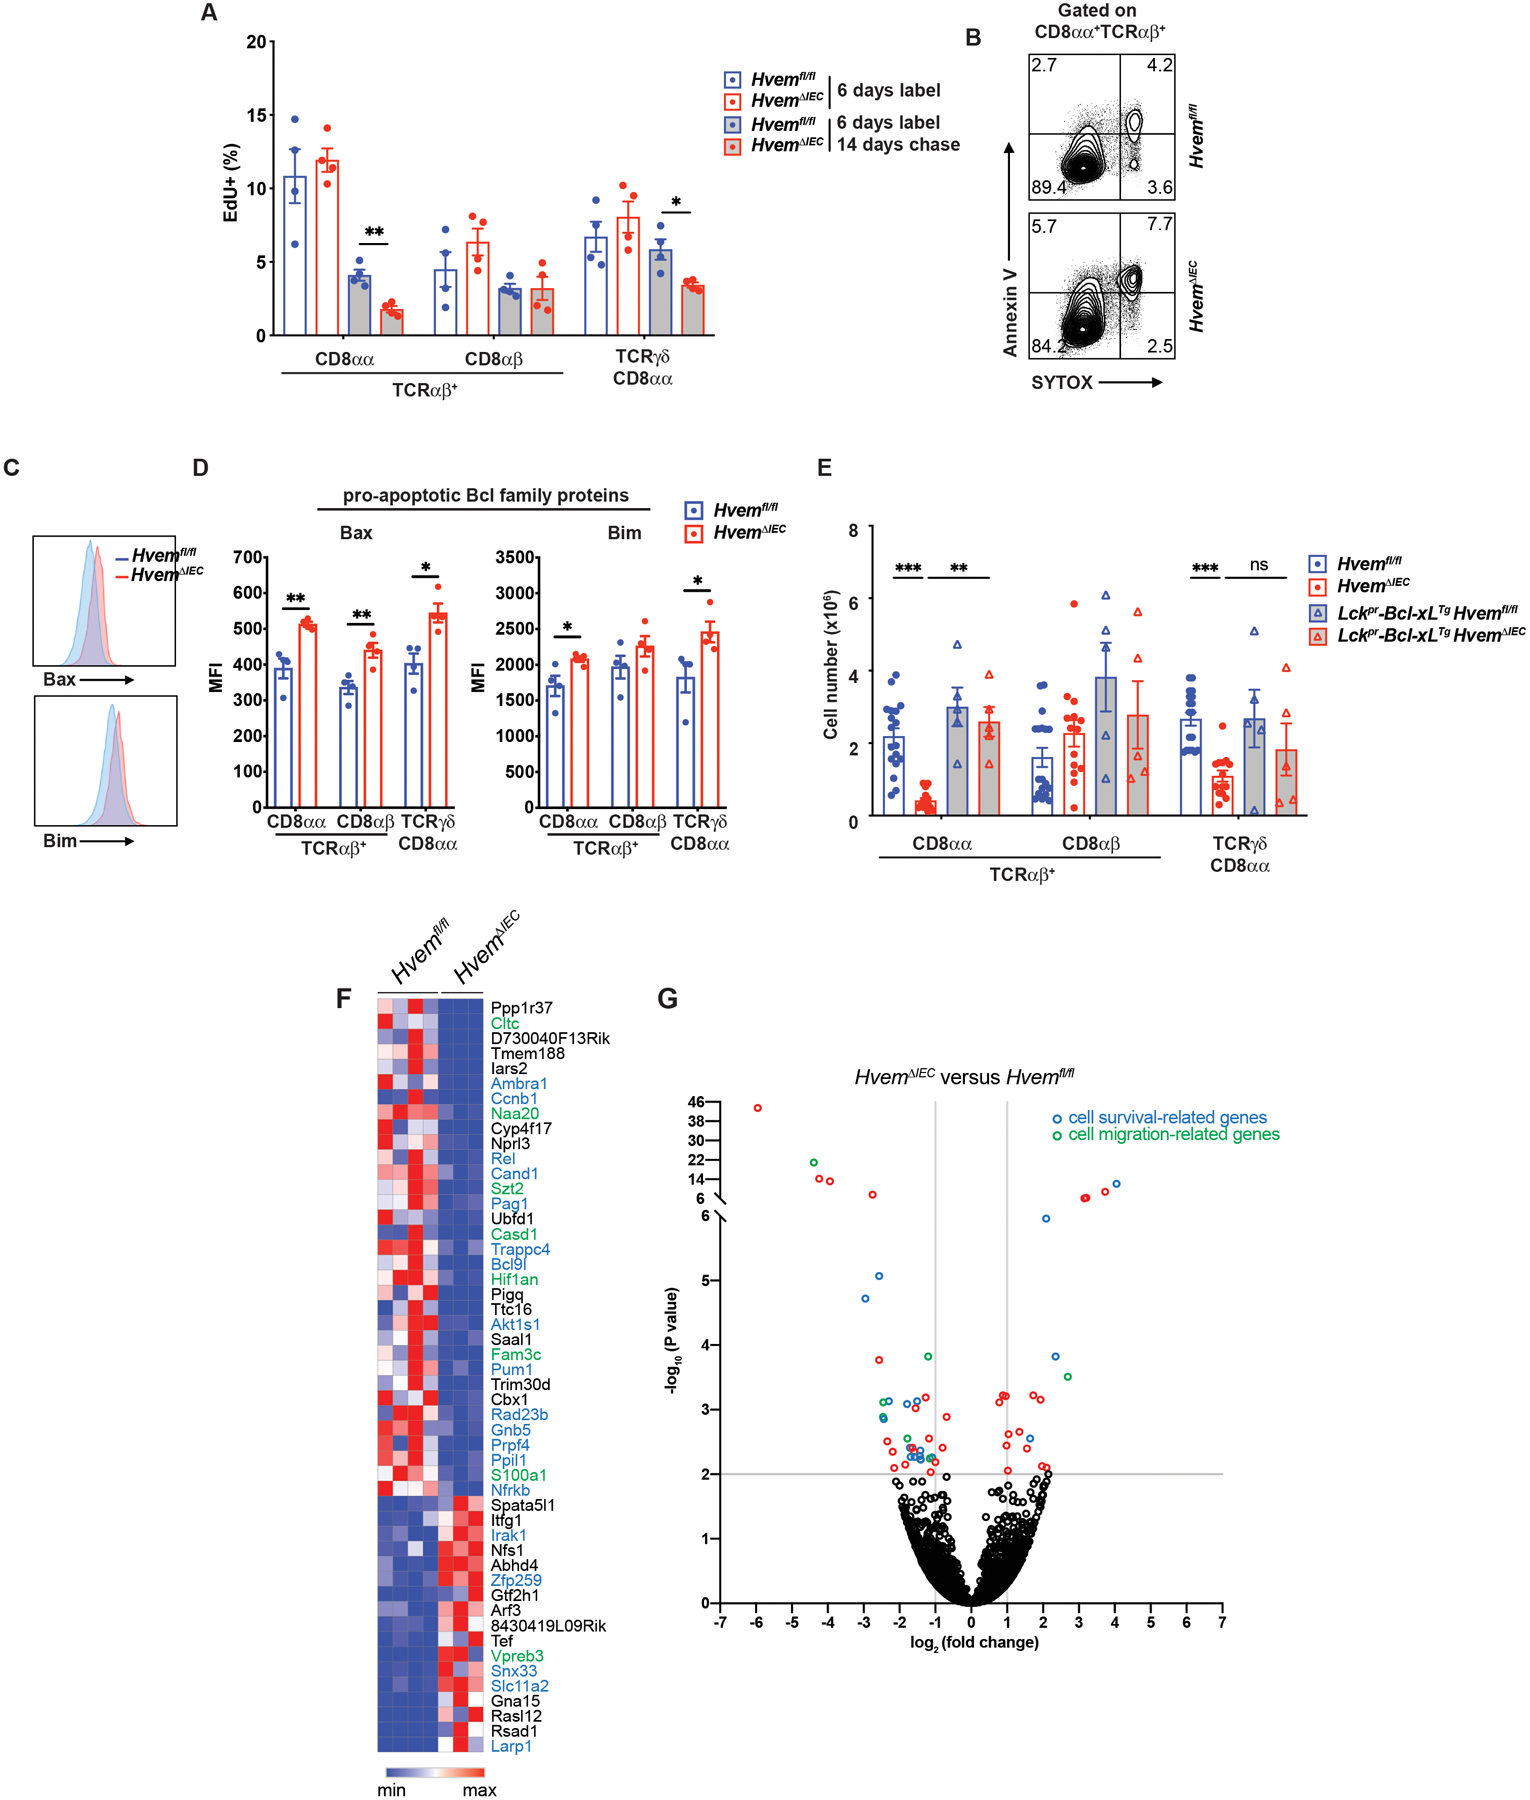
Fig. 3. Epithelial HVEM affects CD8αα+ IET survival.

(A) Frequencies of EdU + cells from proximal SI IET of Hvemfl/fl (n=4) and HvemΔIEC (n=4) mice. Mice were administered EdU once per day for 6 days. Cells were isolated from proximal SI and EdU+ cells were measured at either day 6 or day 20. (B) Representative flow cytometry images detecting apoptotic cells in TCRαβ+CD8αα+ IET from proximal SI in Hvemfl/fl and HvemΔIEC mice.
(C, D) Representative flow cytometry showing expression of pro-apoptotic Bcl family proteins (Bax and Bim) on TCRαβ+CD8αα+ IET from proximal SI of Hvemfl/fl (n=4) and HvemΔIEC (n=4) mice (C) and compiled MFI from multiple individual mice (D). (E) Absolute cell number of TCRαβ+CD8αα+, TCRαβ+CD8αβ+, and TCRγδ+CD8αα+ IET subsets from Hvemfl/fl (n=18), HvemΔIEC (n=14), Lckpr-Bcl-xLTgHvemfl/fl (n=5) and Lckpr-Bcl-xLTgHvemΔIEC (n=5) mice. Statistical analysis was performed using an unpaired t-test (A, D) or 2 way ANOVA with Bonferroni’s multiple comparison test (E). Statistical significance is indicated by *, p < 0.05; **, p < 0.01; ***, p < 0.001. Data in A and C show means ± SEM. In A, D and E, each symbol represents a measurement from a single mouse. Data are representative results of one of at least two independent experiments with at least four mice in each experimental group. (F) Sorted TCRαβ+CD8αα+ IET from SI of Hvemfl/fl and HvemΔIEC mice were analyzed by RNA-seq. The top 50 most differentially expressed genes with respect to P-value. (G) Volcano plots showing mean log2-transformed fold change (x axis) and significance (−log10 (adjusted P value)) of differentially expressed genes between the TCRαβ+CD8αα+ IET from the SI of Hvemfl/fl and HvemΔIEC mice. In F and G, genes in blue font or blue symbol are associated with cell survival or proliferation and those designated with green are associated with cell migration. Groups of co-housed littermates (A-D) or cohoused mice (E) were analyzed.
