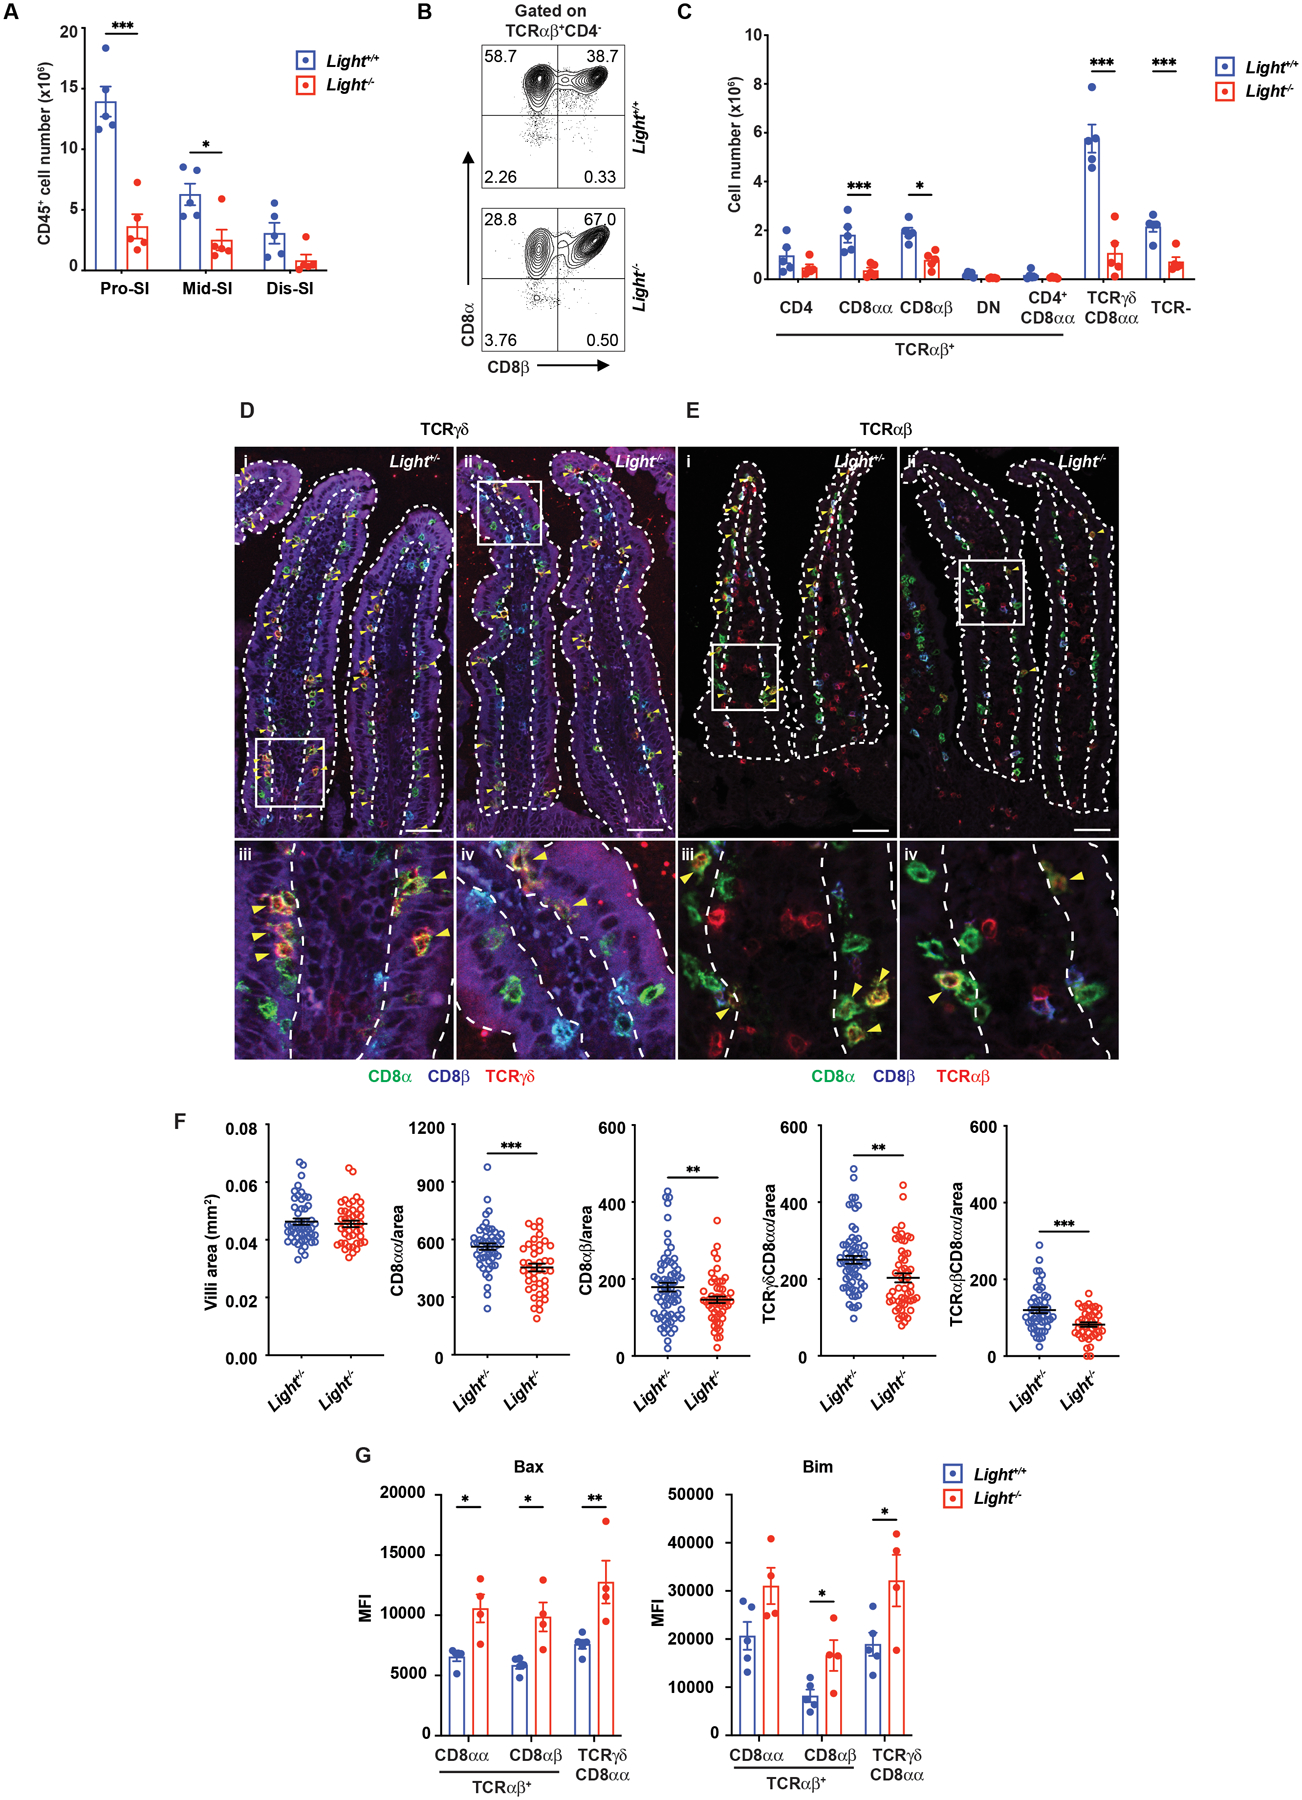
Fig 6. LIGHT is required for IET homeostasis.

(A) Total IEL numbers in portions of the intestine from Light+/+ (n=5) and Light−/− (n=5) mice. (B) Representative plots of TCRαβ+CD8αα+ and TCRαβ+CD8αβ+ in TCRαβ IET from proximal SI in Light+/+ and Light−/− mice. (C) Absolute numbers of indicated IET subsets in total IEL from proximal SI in Light+/+ (n=5) and Light−/− (n=5) mice. (D-E) Representative immunofluorescence staining of TCRγδ IET (D) and TCRαβ IET (E) from proximal SI in Light+/+ and Light−/− mice. Composite images in which the three channels were merged. Composite images depict expression of CD8α (green), CD8β (blue), and TCRδ (red, D) or TCRβ (red, E). Yellow arrowheads highlight TCRγδ+CD8αα+ (D) and TCRαβ+CD8αβ+ IET (E). Dashed white lines indicate the boundaries of the epithelium, approximately one villus in each case, used for the quantitation. Scale bars, 50μm. Two independent experiments were carried out yielding similar results. (F) Quantification of TCRγδ+CD8αα+ and TCRαβ+CD8αβ+ per mm2 from proximal SI in Light+/+ (n=5) and Light−/− (n=4) mice. (G) The MFI of Bax and Bim expression on CD8α+ IET from Light−/− (n=5) and Light+/+ (n=4) mice. Statistical analysis was performed using unpaired t-test (A, C, F, G). Statistical significance is indicated by *, p < 0.05; **, p < 0.01; ***, p < 0.001. Data show means ± SEM. In A, C and G, each symbol represents a measurement from a single mouse. In F, each symbol represents a calculation to give the number per mm2. Data are representative results from one of at least two independent experiments with at least four mice in each experimental group (A, C, G) or pooled results from at least two independent experiments with at least four mice per group in each experiment (F). (A-G) Groups of co-housed littermates were analyzed.
