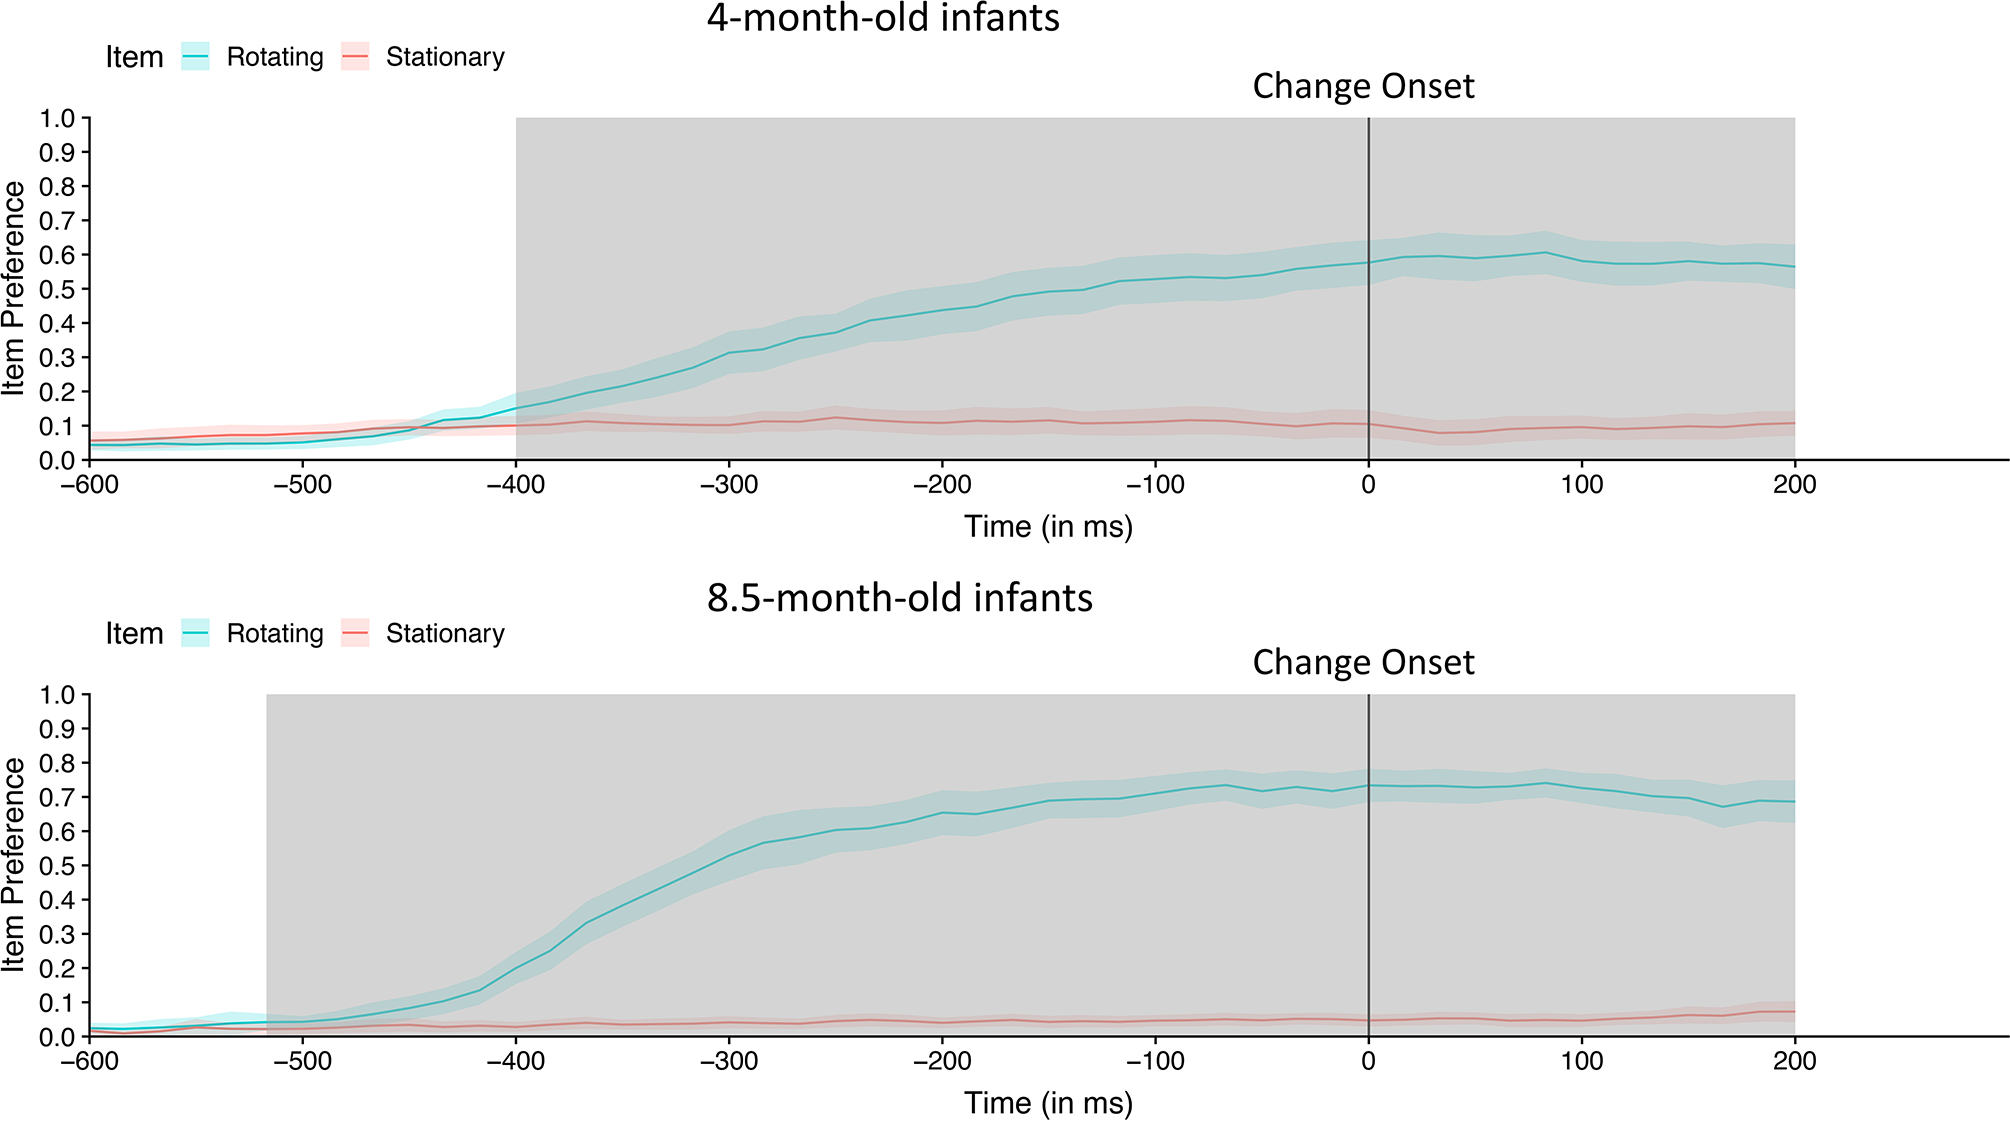
Figure 3.

Time-course of looking to the rotating item (blue line) and non-rotating item (red line) during the attention capture analysis window (200 ms after the onset of the sample array to 200 ms after the onset of the test array) for 4-month-old (top) and 8.5-month-old (bottom) infants in Experiment 1. Each point on the line represents the subject-weighted proportion of trials at each 16.67 ms time point that infants looked at the rotating (blue line) and stationary item (red line); the shading around the lines represents 95% confidence interval for each time point. The two proportions do not equal 1 because infants could be fixating neither item (e.g., looking at the center, being off-task). Permutation analyses identified clusters of time points during which infants fixated rotating item on a statistically significant greater proportion of trials than they fixated the stationary item; those clusters are indicated by gray shading.
