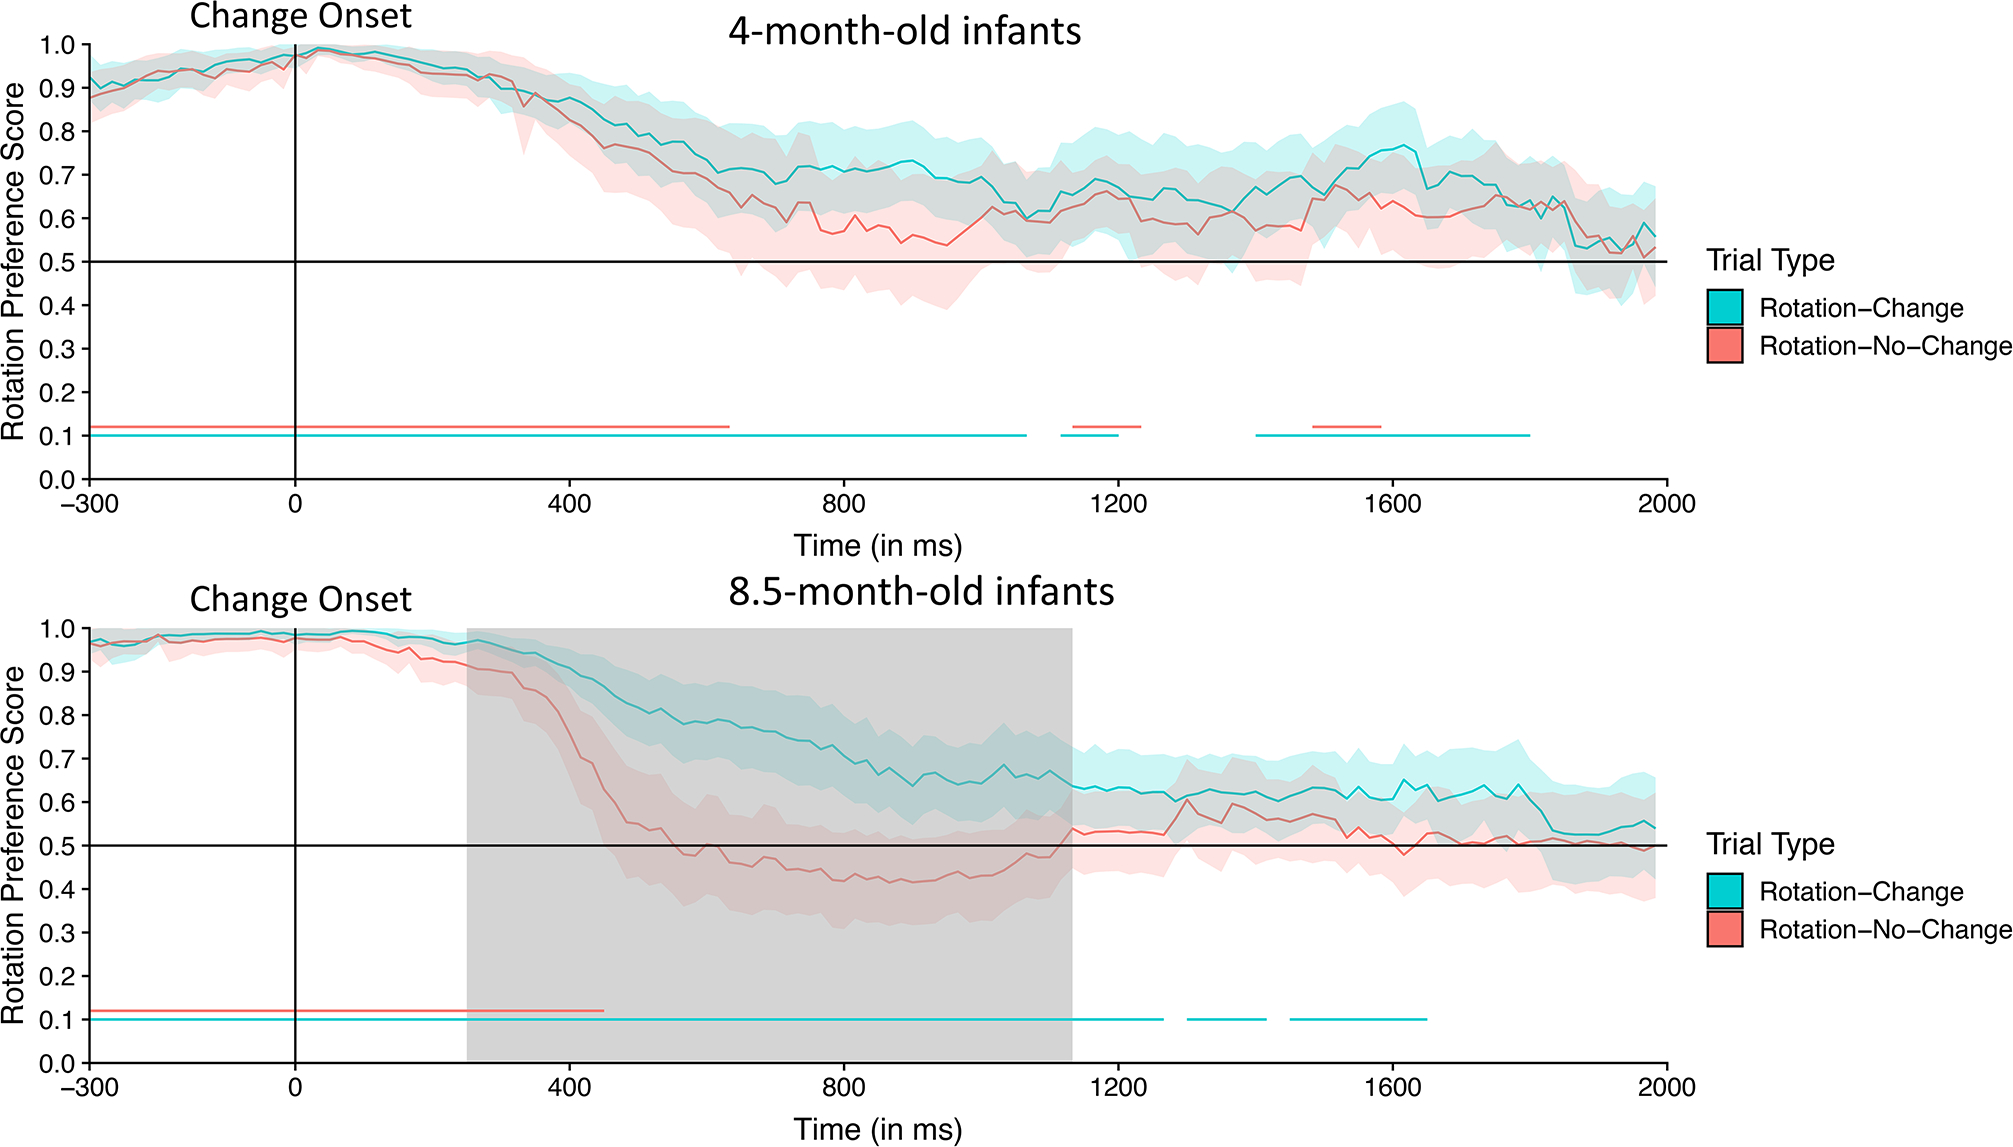
Figure 6.

Time-course of the difference in infants’ rotation preference score for Rotation-Change and Rotation-No-Change trials for the 4-month-old infants (purple) and 8.5-month-old infants (green) during the time-course analysis window (300 ms before the change onset to the end of the trial) in Experiment 1. The lines represent the difference in preference at each 16.67 ms time point before and after the test array appears (indicated by the vertical “Change Onset” line); the shading around these lines represents the 95% confidence interval. Chance performance (0, indicating no difference between the two types of trials) is indicated by the horizontal line bisecting the vertical axis. The gray area represents clusters of time points during which the difference score for the 8.5-month-old infants was significantly greater than that for the 4-month-old infants.
