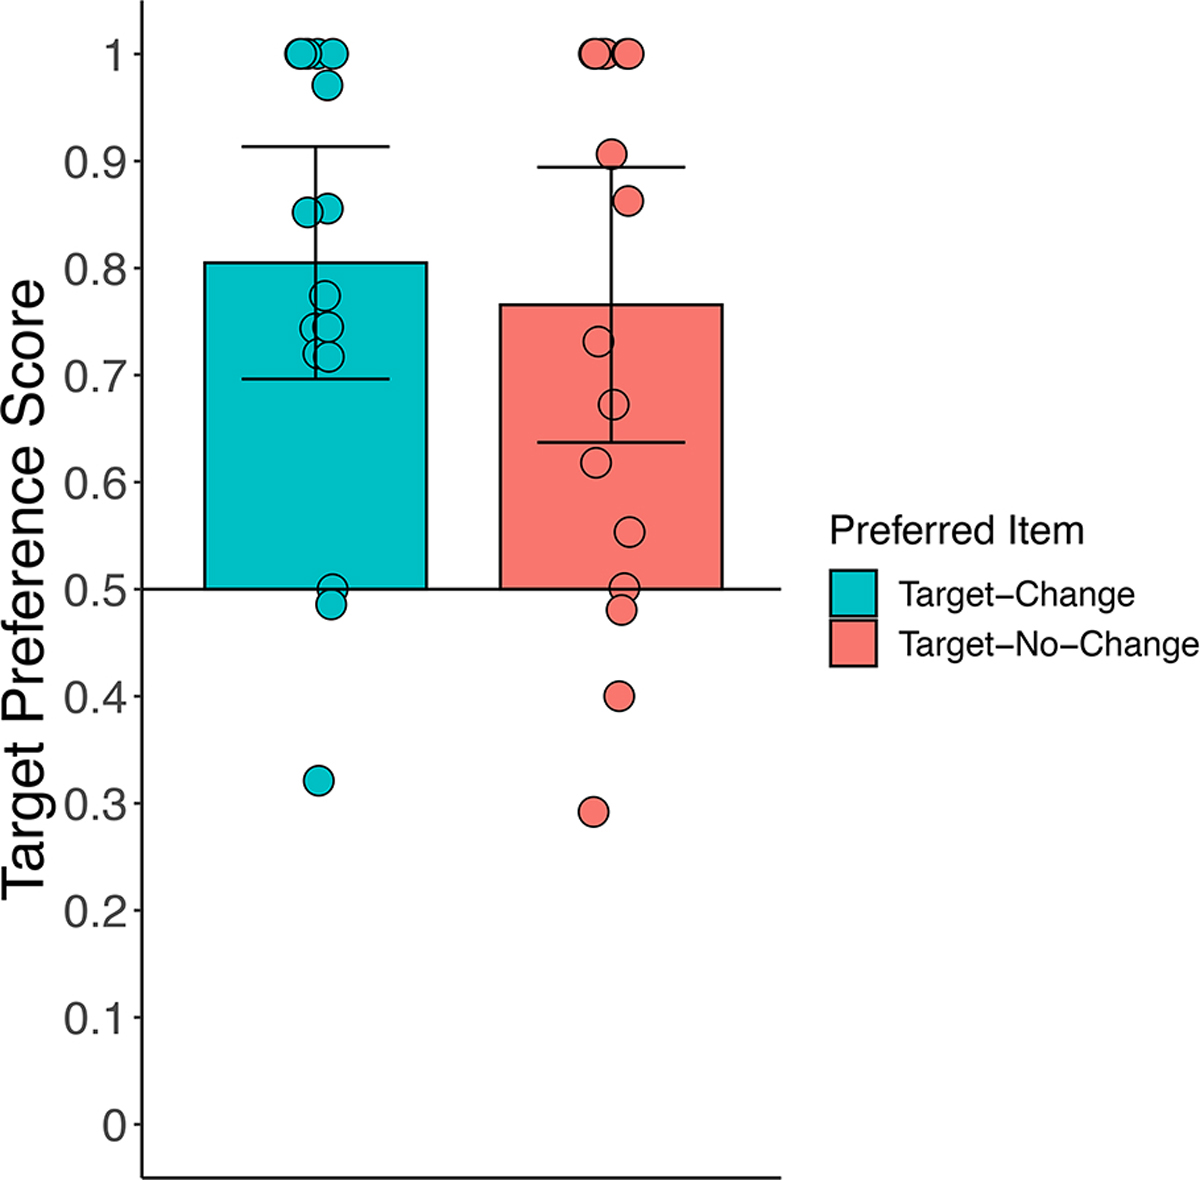
Figure 7.

Target preference scores for the preferred item during the post-change analysis window for trials in which that item changed color (Target-Change trials; blue bars) or remained the same color (Target-No-Change trials; red bars) for Experiment 2. The height of the bar represents the mean score for that trial type for that group of infants, and individual circles represent median preference scores for each infant. Error bars represent the 95% confidence intervals, and the horizontal line bisecting the y-axis represents chance.
