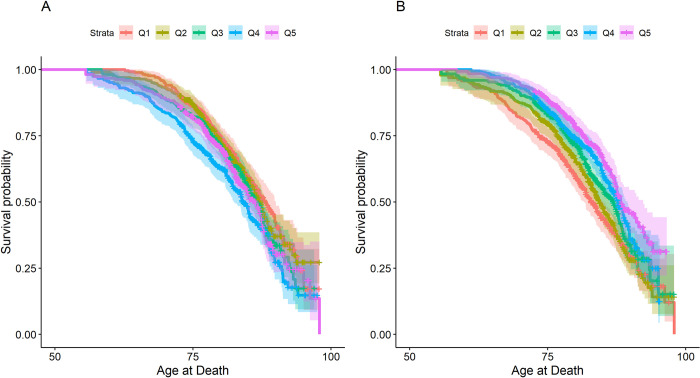
Fig 2.
Survival curves for association between quintiles of African Ancestry (panel A) and nSES (panel B) with all-cause mortality among Self-Identified African American Participants in the Prostate, Lung, Colorectal, and Ovarian Cancer Screening Trial, United States, 1993–2019. Abbreviations: nSES, neighborhood Socioeconomic Status, Legend: Log-rank test p-values (Panel A: p = 0.043, Panel B: p < .0001).

