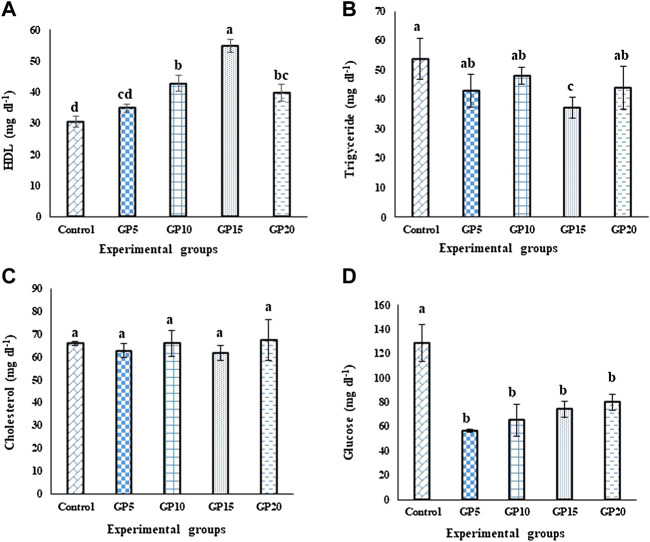
FIGURE 1.
Effects of feeding various experimental diets for 120 days on the (A) high-density lipoprotein (HDL, mg·dl−1) (B) Triglycerides (mg·dl−1) (C) Cholesterol (mg·dl−1), and (D) Glucose (mg·dl−1) levels in the serum of L. rohita. Bars with different letters indicate significant differences (p < 0.05). Data are presented as mean ± standard error of three replicates.

